Note
Go to the end to download the full example code.
sfh2exp: double declining exponential (old population + recent burst)
CIGALE’s sfh2exp star-formation history superposes an old, exponentially
declining main population with a second, more recent exponential burst that
contributes a fixed fraction f_burst of the total stellar mass formed. It
is the classic parametrization for post-starburst and rejuvenated systems.
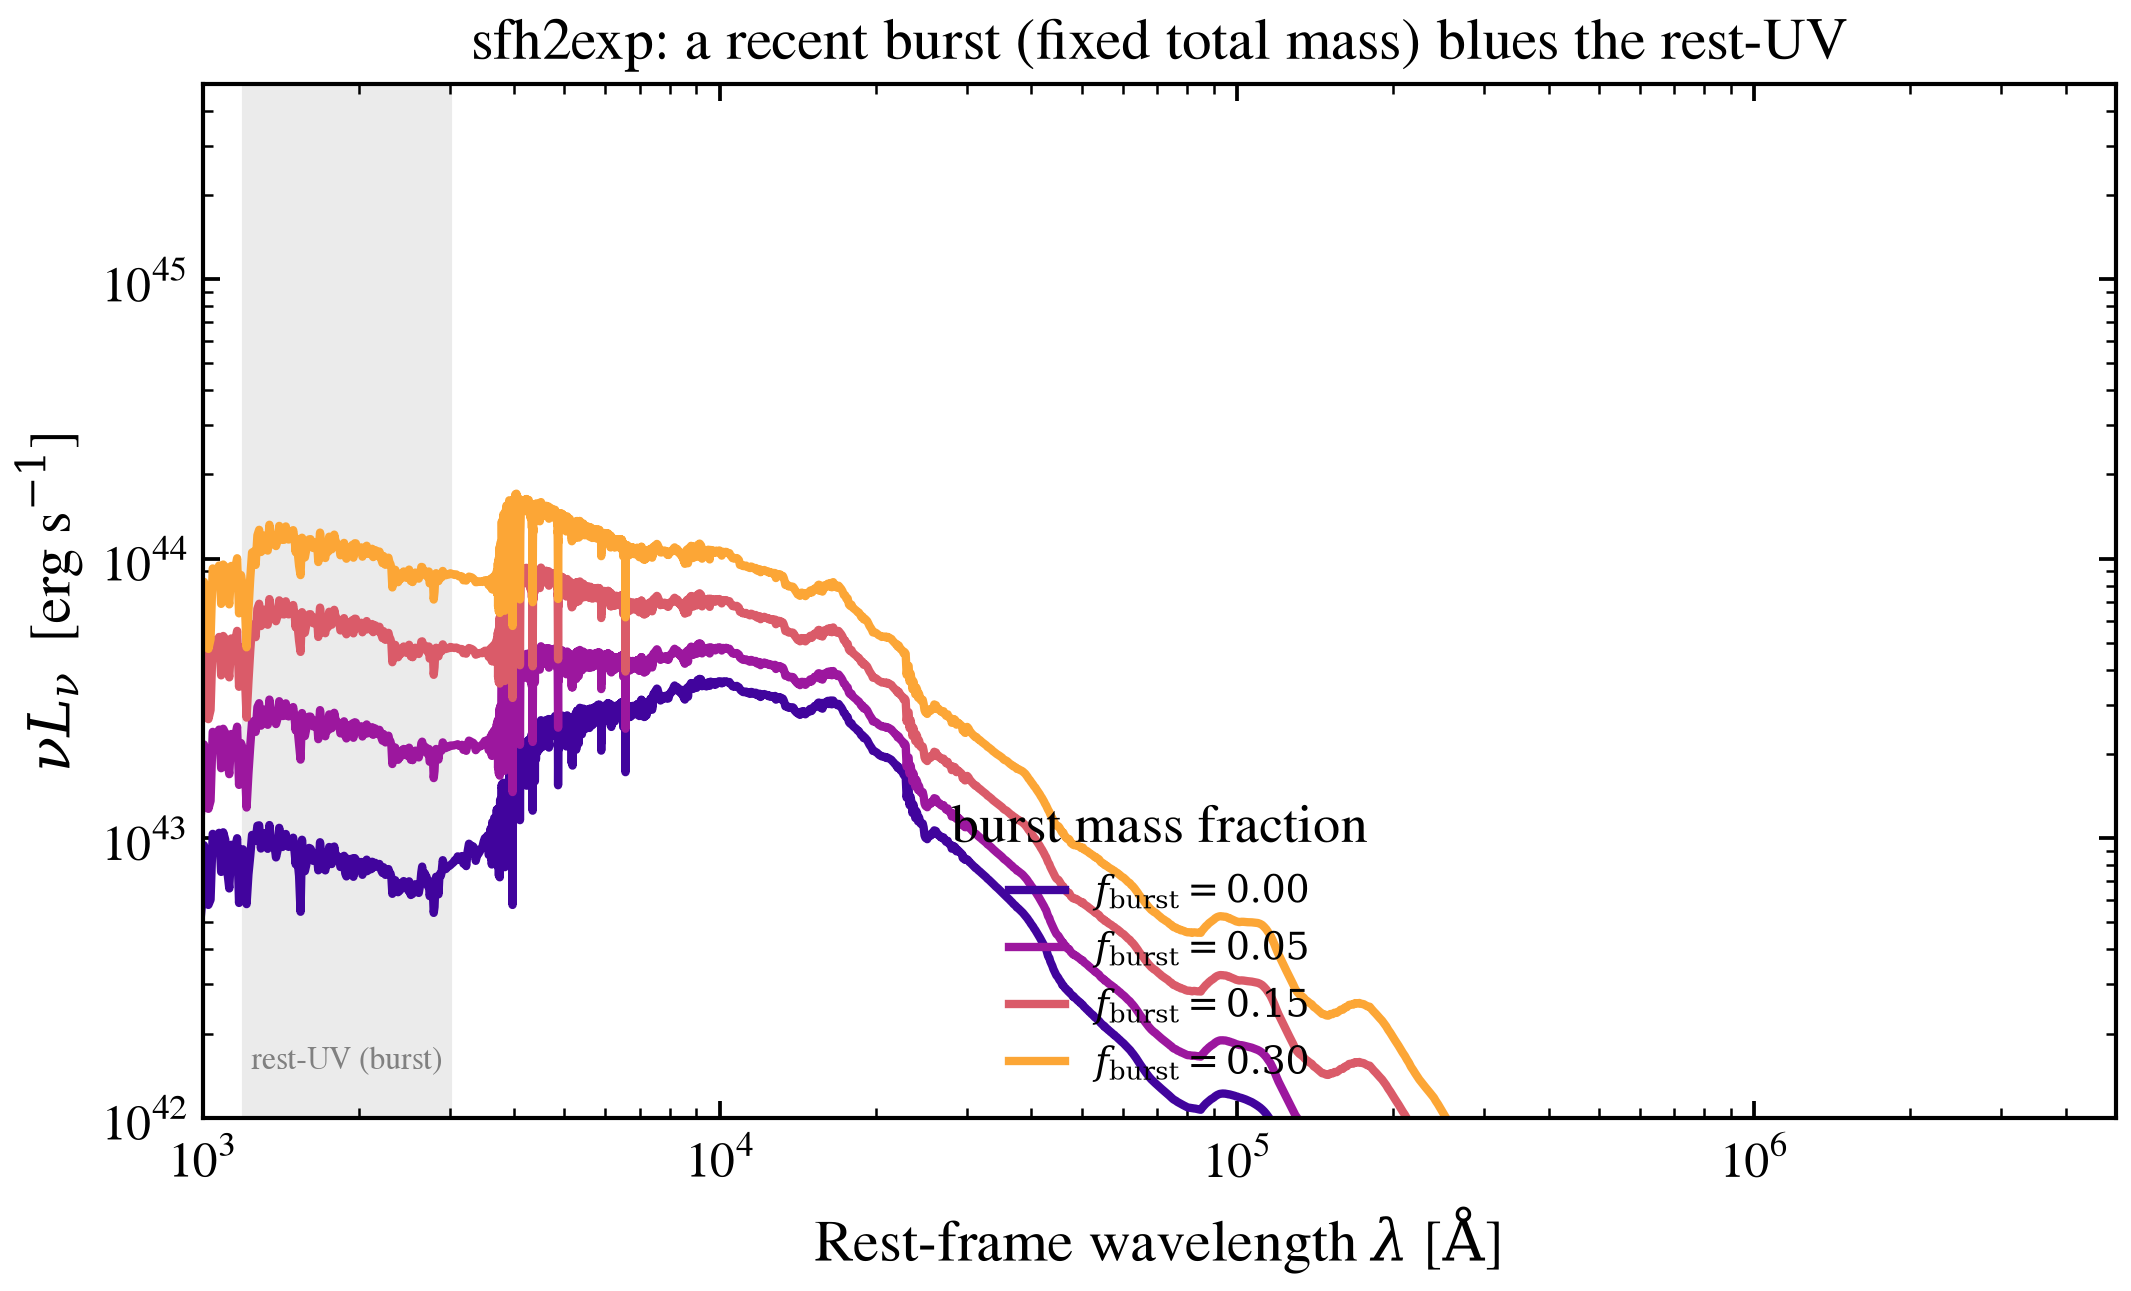
This sweeps the burst mass fraction at a fixed recent burst age, showing how the burst lifts the recent SFR (top panel) and blues the rest-frame UV continuum (bottom panel). The total stellar mass is held fixed, so a larger burst necessarily draws mass away from the old population.
import os

os.environ["TF_CPP_MIN_LOG_LEVEL"] = "2"

import warnings

import jax
import matplotlib.pyplot as plt
import numpy as np

import tengri
from tengri.plot import setup_style

setup_style()
warnings.filterwarnings("ignore", message=".*BakedInBackend.*")

C_AA_PER_S = 2.998e18
ssp = tengri.load_ssp()


def build(f_burst):
    return tengri.SEDModel.build(
        ssp,
        sfh={
            "type": "sfh2exp",
            "all_params": tengri.Fixed(tengri.DEFAULT),
            "log_total_mass": 10.5,
            "tau_main_gyr": 4.0,
            "tau_burst_gyr": 0.1,
            "f_burst": f_burst,
            "age_gyr": 10.0,
            "burst_age_gyr": 0.3,
        },
        dust_attenuation={
            "law": "power_law",
            "type": "two_component",
            "all_params": tengri.Fixed(tengri.DEFAULT),
            "tau_diff": 0.2,
            "tau_bc": 0.2,
        },
        redshift=tengri.Fixed(0.05),
    )


f_burst_values = [0.0, 0.05, 0.15, 0.3]
colors = plt.cm.plasma(np.linspace(0.1, 0.8, len(f_burst_values)))

fig, ax = plt.subplots(figsize=(7.4, 4.6))

for f, c in zip(f_burst_values, colors):
    model = build(f)
    p = dict(model.spec.sample(jax.random.PRNGKey(0)))
    out = model.predict(p)
    wave = np.asarray(model.wavelengths)
    nu_l_nu = C_AA_PER_S / wave * np.asarray(out.rest_sed())
    ax.loglog(wave, nu_l_nu, color=c, lw=2.0, label=rf"$f_{{\rm burst}}={f:.2f}$")

# Rest-frame UV window where the young burst dominates.
ax.axvspan(1.2e3, 3e3, color="0.92", zorder=0)
ax.text(1.9e3, 1.4e42, "rest-UV (burst)", fontsize=7.5, color="0.5", ha="center", va="bottom")

ax.set(
    xlim=(1e3, 5e6),
    ylim=(1e42, 5e45),
    xlabel=r"Rest-frame wavelength $\lambda$ [$\mathrm{\AA}$]",
    ylabel=r"$\nu L_\nu$  [erg s$^{-1}$]",
    title="sfh2exp: a recent burst (fixed total mass) blues the rest-UV",
)
ax.legend(frameon=False, fontsize=9, loc="lower center", title="burst mass fraction")

fig.tight_layout()
plt.savefig("plot_sfh2exp_main_plus_burst.png", dpi=150, bbox_inches="tight")