Note
Go to the end to download the full example code.
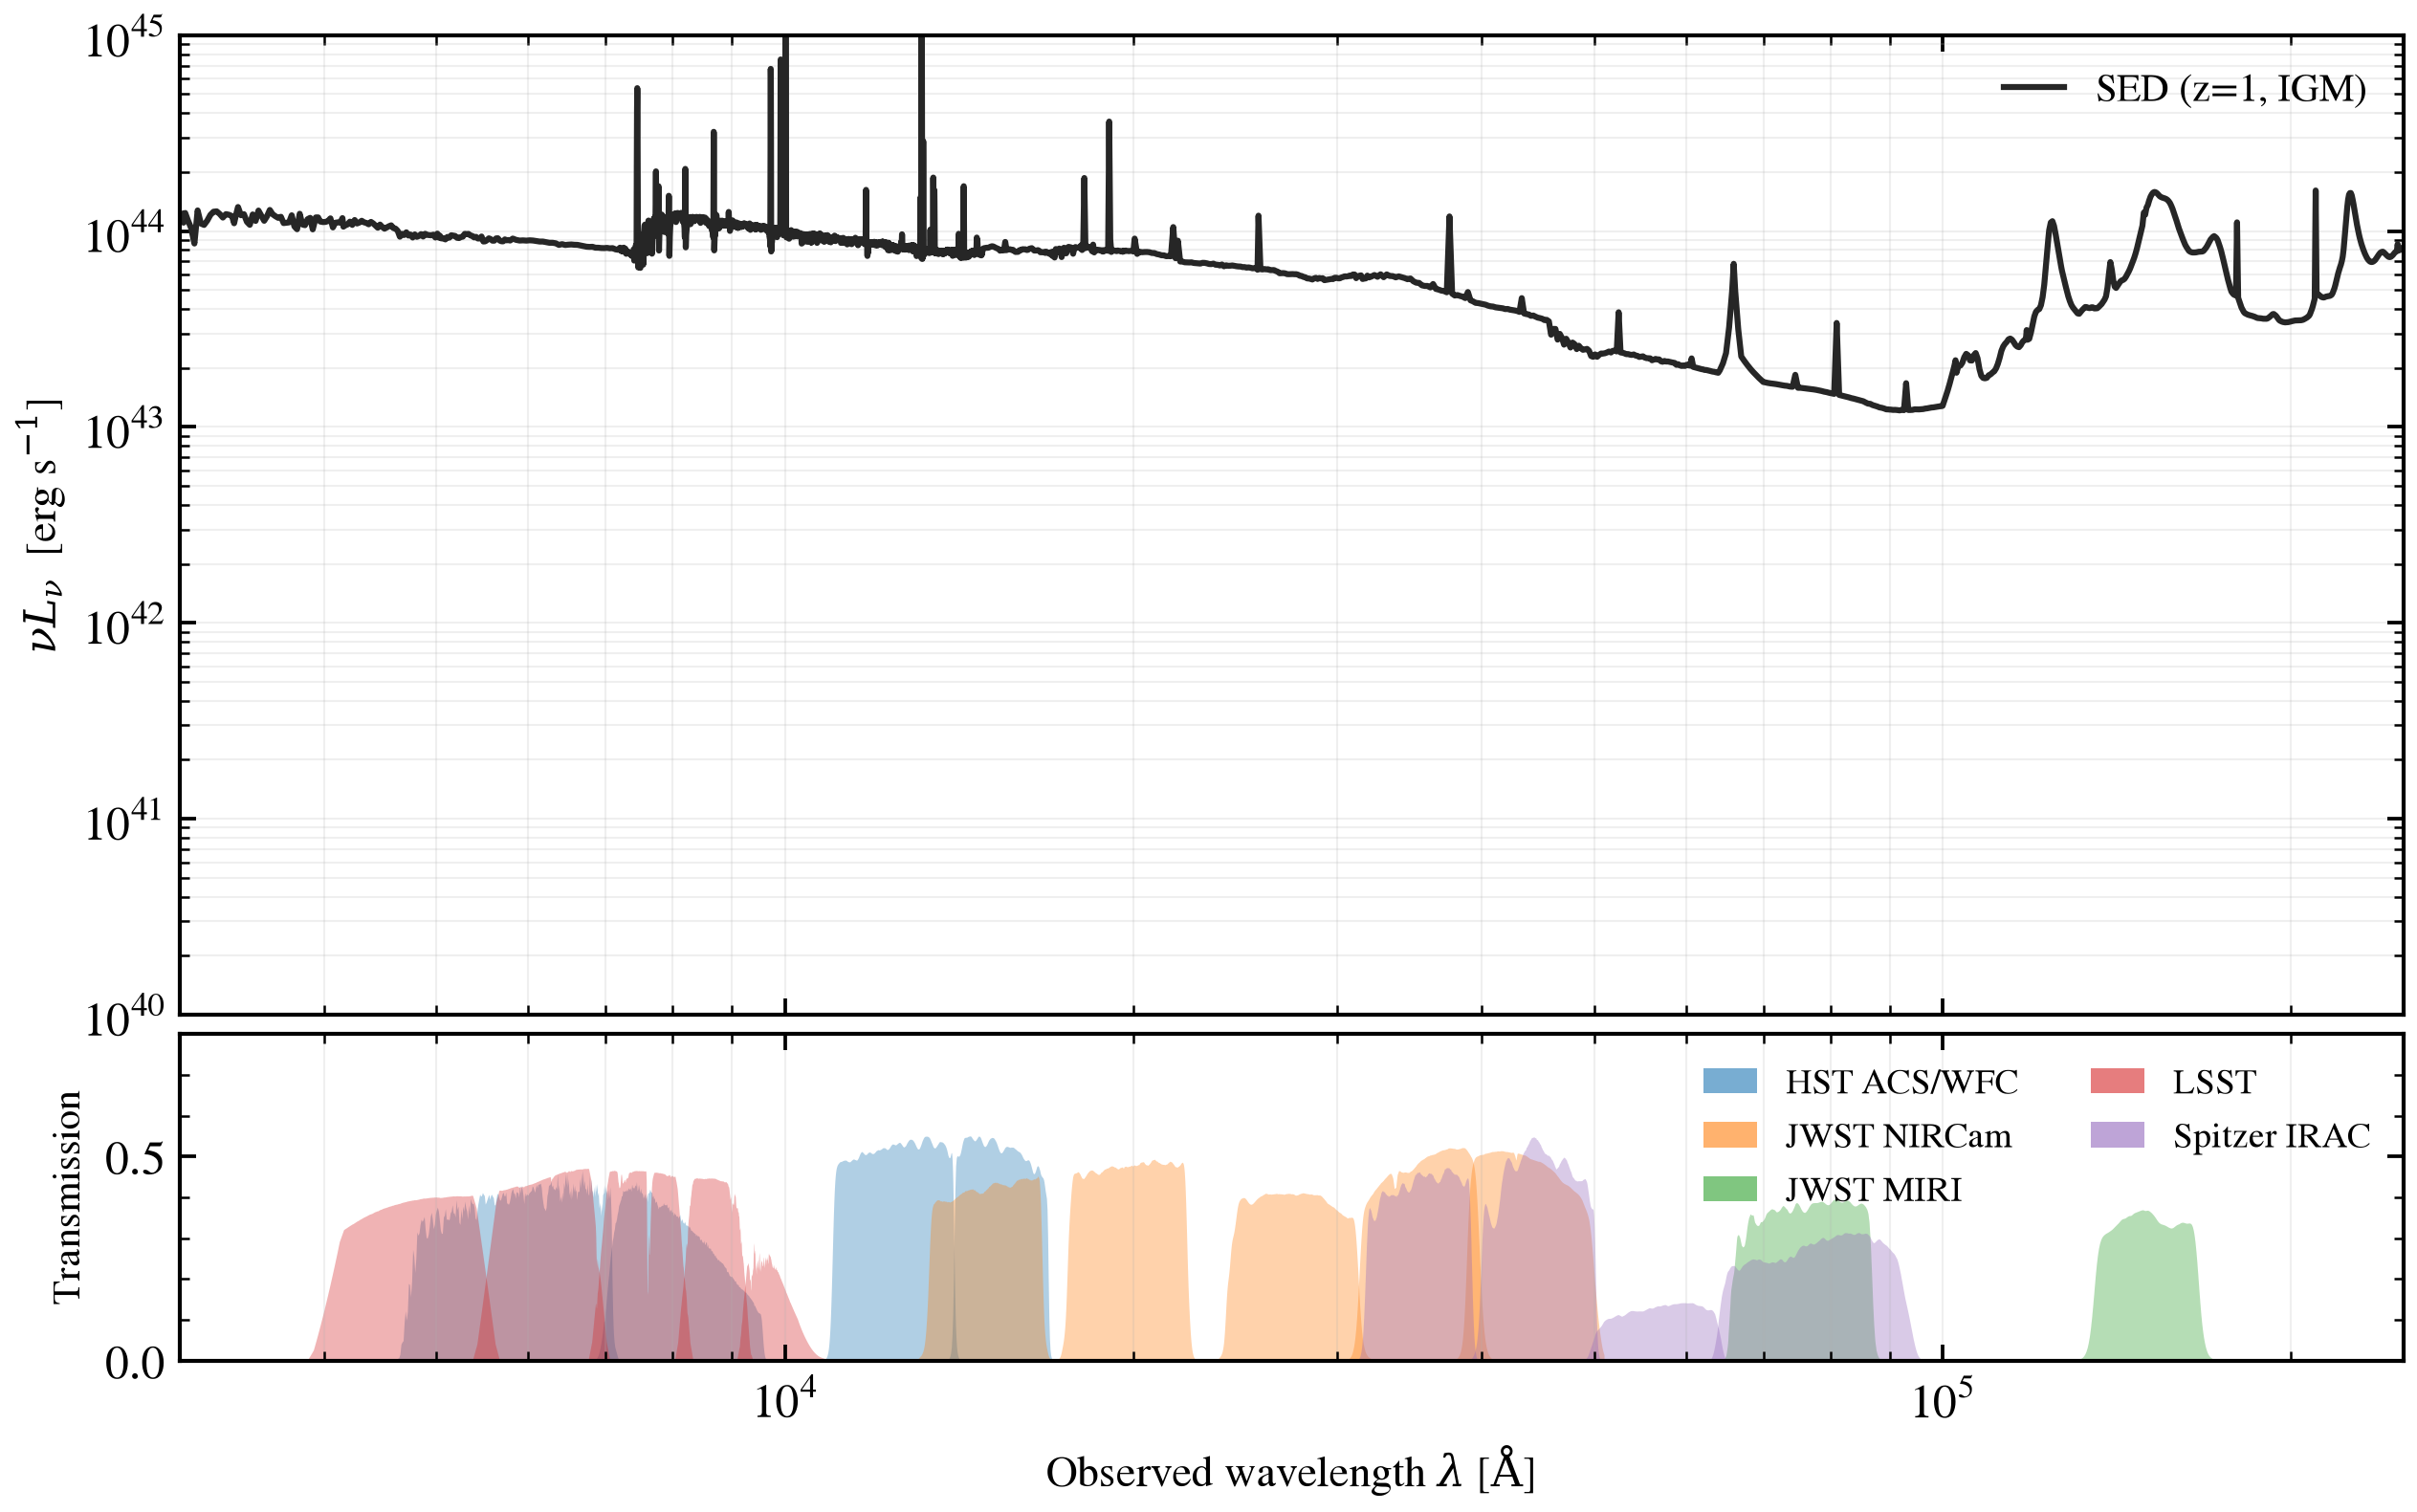
HST+JWST+LSST+Spitzer Filter Overlay on Star-Forming SED at z=1
Show a typical star-forming galaxy SED at z=1 with observed-frame filter throughputs overlaid as semi-transparent fills from 0.3 to 25 μm. This helps visualize which rest-frame stellar and dust features each photometric system samples across the spectrum.
Filters displayed:
HST ACS/WFC: F606W, F814W, F125W, F160W (optical/NIR imaging)
JWST NIRCam: F150W, F200W, F277W, F356W, F444W (short-wavelength)
JWST MIRI: F770W, F1500W (mid-infrared)
LSST: g, r, i, z, y (optical survey filters)
Spitzer IRAC: 3.6, 4.5, 5.8, 8.0 μm (legacy warm IR)
The SED uses a starburst history (τ = 100 Myr) with two-component dust and sfr-scaled nebular emission, rendered in the observer frame at z=1 with complete IGM attenuation.
/tengri/examples/photometry/plot_filter_throughput_overlay.py:166: UserWarning: This figure includes Axes that are not compatible with tight_layout, so results might be incorrect.
  fig.tight_layout()
import os

os.environ["TF_CPP_MIN_LOG_LEVEL"] = "2"  # suppress XLA/PjRt C++ INFO+WARNING logs

import warnings

import jax
import matplotlib.pyplot as plt
import numpy as np

import tengri
from tengri import load_filter
from tengri.igm import igm_transmission
from tengri.plot import setup_style

setup_style()
warnings.filterwarnings("ignore", message=".*BakedInBackend.*")

# Physical constants
C_AA_PER_S = 2.998e18

# Build a star-forming model at z=1 with simple parameters
z = 1.0
sfh_config = {
    "type": "tsnorm",
    "all_params": tengri.Fixed(tengri.DEFAULT),
    "peak_lbt_gyr": 0.1,  # Peak 100 Myr ago (recent burst)
    "width_gyr": 0.1,  # Duration 100 Myr
    "log_total_mass": 10.0,  # SFR ≈ 30 M_sun/yr
    "skew": 0.0,  # Symmetric
    "trunc": 13.0,  # Truncate at z_form ~ z+1
}

dust_config = {
    "type": "two_component",
    "all_params": tengri.Fixed(tengri.DEFAULT),
    "tau_diff": 0.3,  # Diffuse attenuation
    "tau_bc": 0.5,  # Dust clouds
    "law": "calzetti",  # Starburst attenuation law
}
dust_emission = {"type": "dale2014", "all_params": tengri.Fixed(tengri.DEFAULT)}

# Build the model using bare-stellar SSP with Cue nebular backend
model = tengri.SEDModel.build(
    ssp_data=tengri.load_ssp("fsps_prsc_miles_chabrier"),
    sfh=sfh_config,
    dust_attenuation=dust_config,
    dust_emission=dust_emission,
    neb={
        "type": "cue",
        "all_params": tengri.Fixed(tengri.DEFAULT),
        "logZ_gas": -0.5,
        "logU": -2.0,
    },
    redshift=tengri.Fixed(z),
)

# Sample parameters and compute rest-frame SED
p = dict(model.spec.sample(jax.random.PRNGKey(42)))
out_rest = model.predict(p)
wave_rest = np.asarray(model.wavelengths)
sed_rest = np.asarray(out_rest.rest_sed())

# Apply IGM attenuation and shift to observer frame
igm_trans = igm_transmission(wave_rest * (1 + z), z)
sed_igm = sed_rest * igm_trans
wave_obs = wave_rest * (1 + z)

# Convert to nu*L_nu for display (erg/s)
nu_l_nu = C_AA_PER_S / wave_obs * sed_igm

# Define filter groups with colors
FILTERS_BY_GROUP = [
    ("HST ACS/WFC", ["hst_f606w", "hst_f814w", "hst_f125w", "hst_f160w"], "#1f77b4"),
    (
        "JWST NIRCam",
        ["jwst_f150w", "jwst_f200w", "jwst_f277w", "jwst_f356w", "jwst_f444w"],
        "#ff7f0e",
    ),
    ("JWST MIRI", ["miri_f770w", "miri_f1500w"], "#2ca02c"),
    ("LSST", ["lsst_g", "lsst_r", "lsst_i", "lsst_z", "lsst_y"], "#d62728"),
    ("Spitzer IRAC", ["irac_36", "irac_45", "irac_58", "irac_80"], "#9467bd"),
]

# Create figure: SED on top, filter transmission bars below
fig, (ax_sed, ax_filt) = plt.subplots(
    2,
    1,
    figsize=(10.0, 6.0),
    sharex=True,
    gridspec_kw={"height_ratios": [3, 1], "hspace": 0.03},
)

# Plot SED in observer frame (0.3–25 μm)
vis = (wave_obs >= 3e3) & (wave_obs <= 2.5e5)  # 0.3–25 μm in Angstrom
ax_sed.loglog(wave_obs[vis], nu_l_nu[vis], color="0.15", lw=1.5, label="SED (z=1, IGM)")
ax_sed.set_ylabel(r"$\nu L_\nu$  [erg s$^{-1}$]", fontsize=11)
ax_sed.set_ylim(1e40, 1e45)
ax_sed.legend(frameon=False, loc="upper right", fontsize=10)
ax_sed.grid(True, alpha=0.2, which="both")

# Overlay filter transmission curves
loaded = 0
first_failure: Exception | None = None

for label, filter_names, color in FILTERS_BY_GROUP:
    for fname in filter_names:
        try:
            f = load_filter(fname)
            ax_filt.fill_between(
                np.asarray(f.wave),
                0,
                np.asarray(f.trans),
                color=color,
                alpha=0.35,
                lw=0,
            )
            loaded += 1
        except Exception as e:
            if first_failure is None:
                first_failure = e
            continue

    # Legend handle: one opaque rectangle per group
    ax_filt.fill_between([], [], color=color, alpha=0.6, label=label, edgecolor="none")

# The legend handles above are `fill_between([], [], ...)` -- collections with
# no data. Every filter failing therefore leaves a panel that still has artists
# and a complete legend, so only a count of real loads detects it.
if loaded == 0:
    raise RuntimeError(
        "no filter transmission curve could be loaded, so the throughput panel "
        f"is empty behind a full legend. First failure: "
        f"{type(first_failure).__name__}: {first_failure}"
    ) from first_failure

ax_filt.set_ylim(0, 0.8)
ax_filt.set_xlabel(r"Observed wavelength $\lambda$ [$\mathrm{\AA}$]", fontsize=11)
ax_filt.set_ylabel("Transmission", fontsize=10)
ax_filt.legend(frameon=False, fontsize=9, loc="upper right", ncol=2)
ax_filt.grid(True, alpha=0.2, which="both", axis="x")
ax_sed.set_xlim(3e3, 2.5e5)

fig.tight_layout()
plt.savefig("plot_filter_throughput_overlay.png", dpi=150, bbox_inches="tight")