Note
Go to the end to download the full example code.
Cosmic dimming and K-correction with redshift
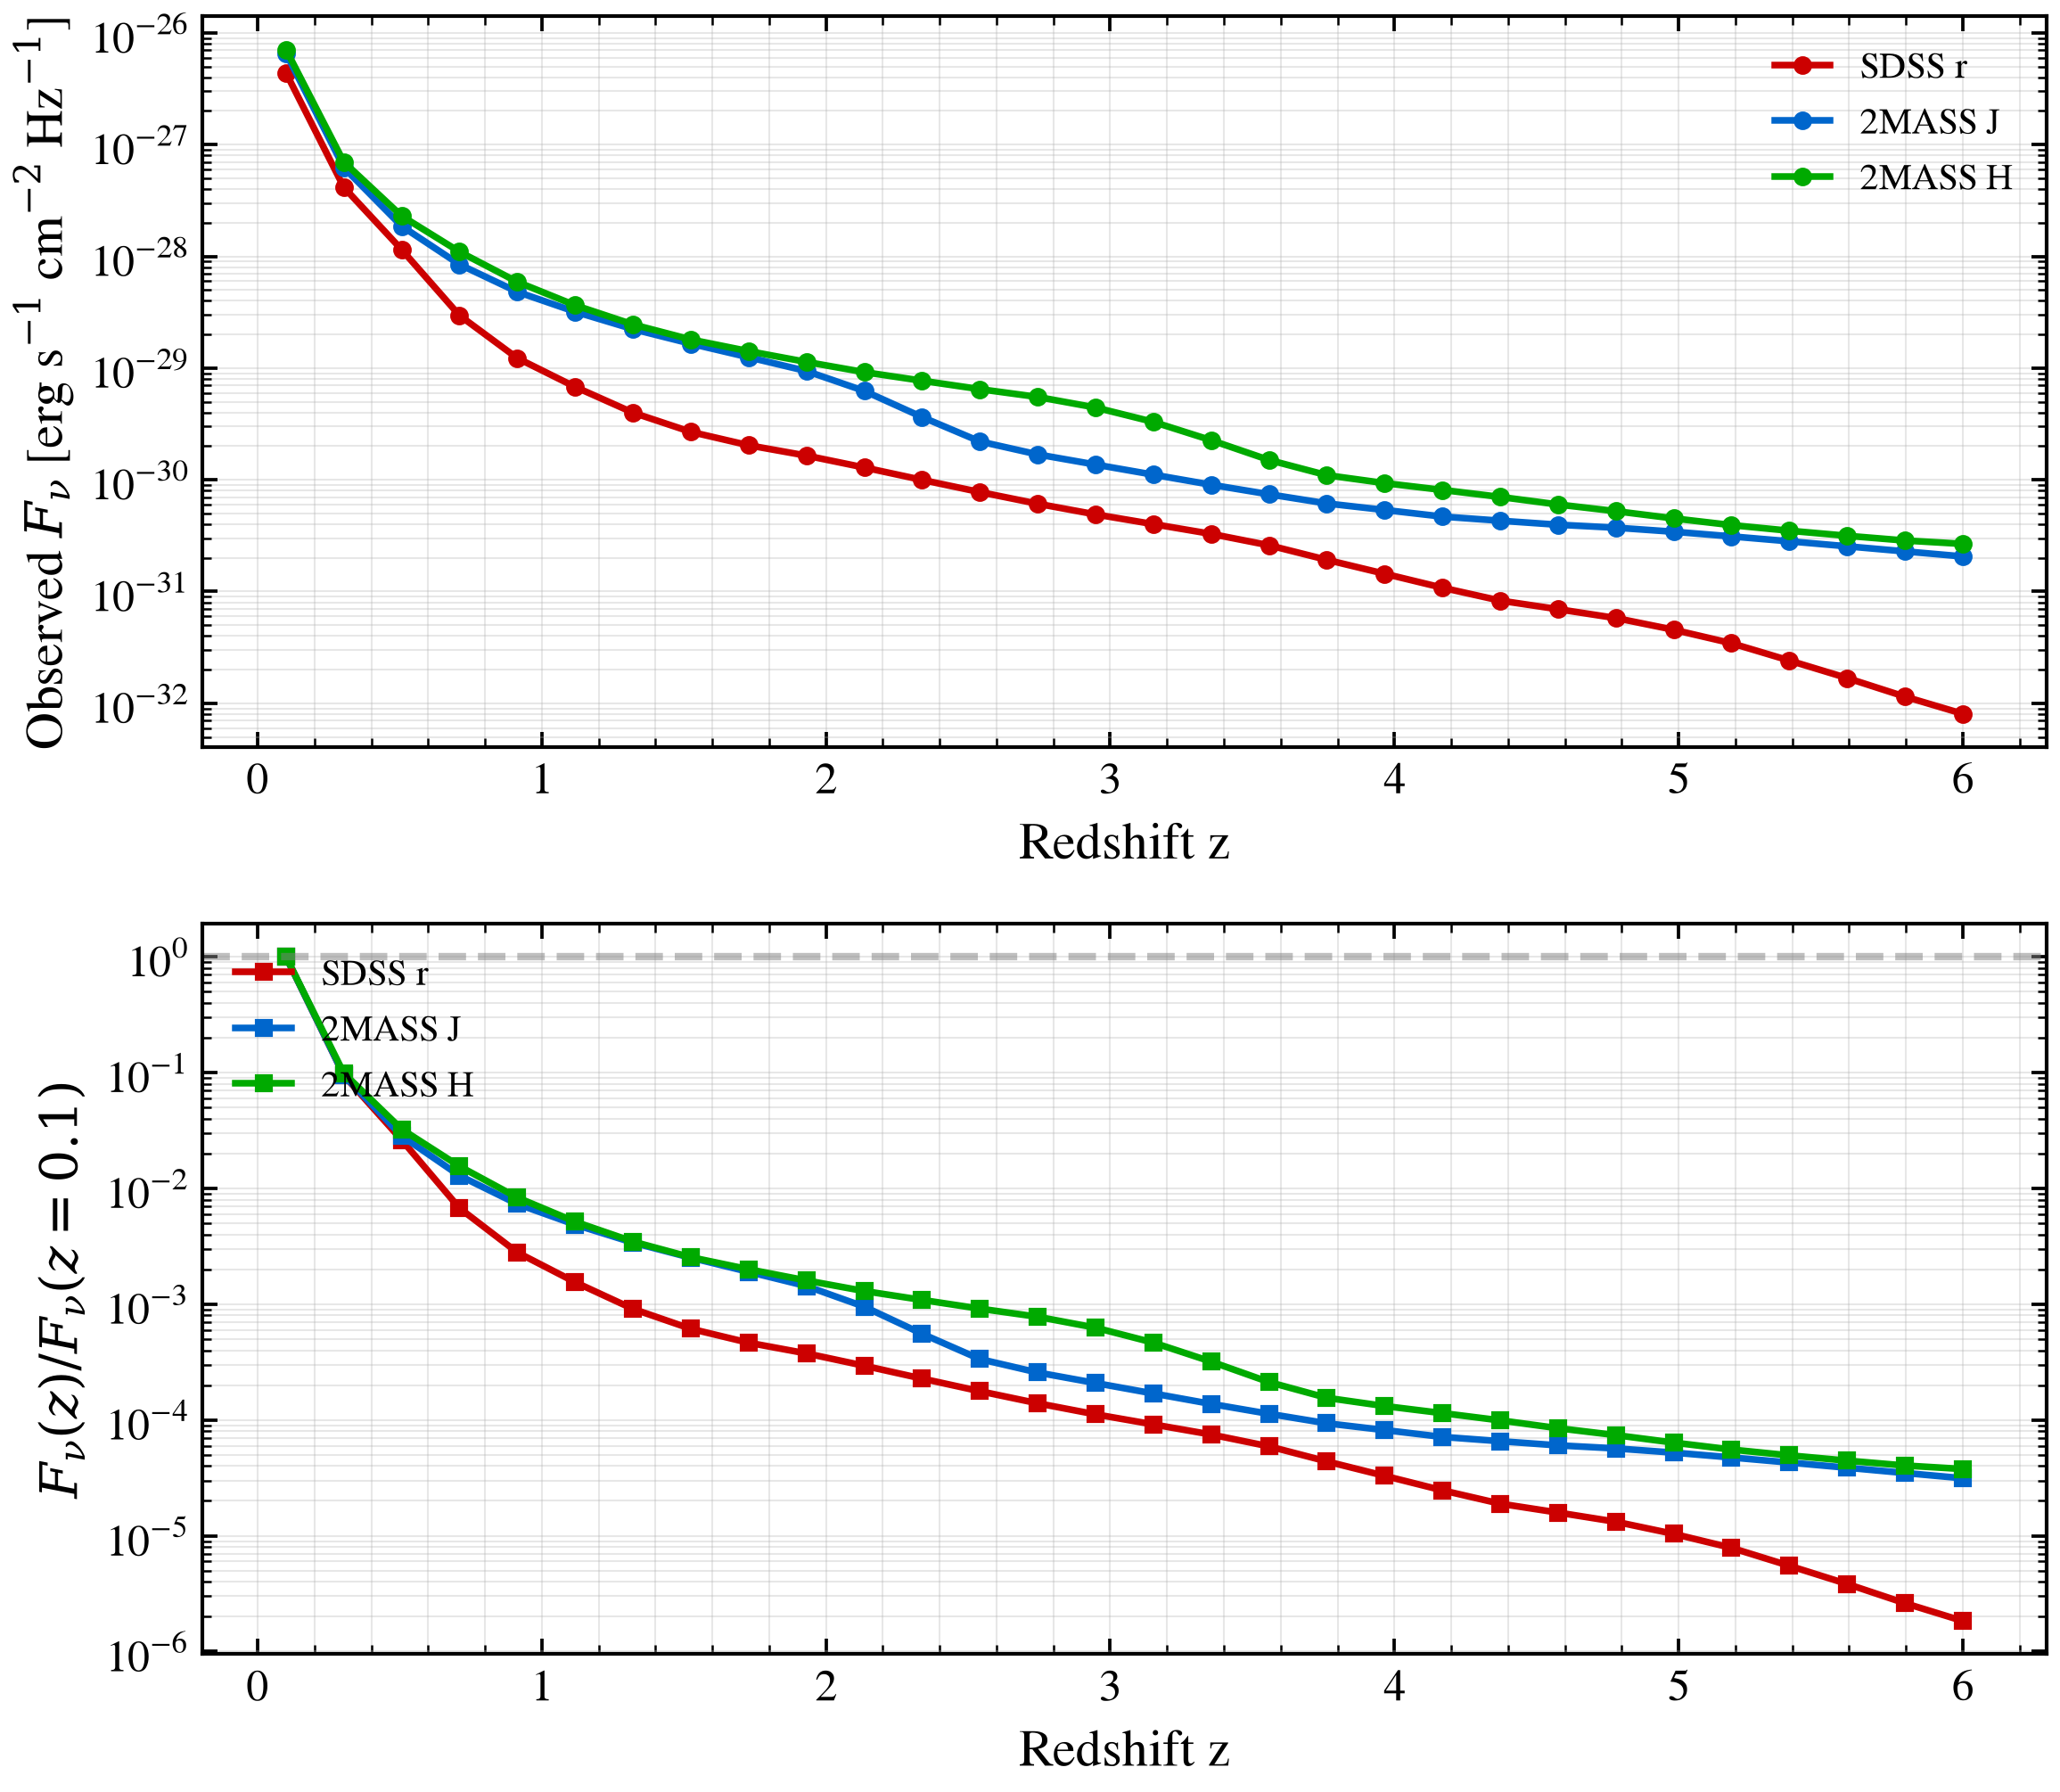
How does the observed photometric flux of a FIXED-luminosity galaxy decline with redshift? We track a star-forming galaxy (log M* = 10.5, SFR = 10 M☉/yr) across z = 0.1 to 6 in three optical/infrared bands (SDSS r, JWST J, JWST H), visualizing the three physical effects:
Inverse-luminosity-distance squared ($(1+z)^{-2}$ geometric dilution) — the dominant effect, present in all bands equally.
K-correction (filter wavelength → rest frame due to redshift) — bands sample different parts of the SED as redshift increases, causing differential dimming.
IGM absorption (Lyman blanketing, Lyman forest) — erases UV flux above z ≳ 3.
The figure shows this via two panels:
Top: Observed F_ν in each band vs redshift, revealing raw flux evolution.
Bottom: Flux normalized to z = 0.1, isolating K-correction and IGM effects from the geometric term.
Reference: Tolman (1930) and Whitford (1958) on the meaning of cosmological surface brightness; Sandage (1988) on K-corrections as pedagogical tools.
import os

os.environ["TF_CPP_MIN_LOG_LEVEL"] = "2"  # suppress XLA/PjRt C++ INFO+WARNING logs


import warnings

import jax
import matplotlib

matplotlib.use("Agg")
import matplotlib.pyplot as plt
import numpy as np

jax.config.update("jax_enable_x64", True)

import tengri
from tengri.plot import setup_style

setup_style()

# The shipped SSP bakes its nebular emission in at a fixed logU, which this
# example neither varies nor discusses. Its siblings filter the same warning;
# left unfiltered it is captured verbatim into the rendered page, absolute
# source path and all, which is what tools/check_no_local_paths.py exists to
# stop from reaching the public docs.
warnings.filterwarnings("ignore", message=".*BakedInBackend.*")


# Load SSP stellar population synthesis grid
ssp = tengri.load_ssp()

# Define the observation: three bands sampling optical to near-infrared
# SDSS r: rest-frame optical, samples Balmer continuum at low z
# 2MASS J, H: rest-frame near-IR, sample stellar continuum longward of 1 µm
#
# No cache_dir: tengri resolves each curve across its own data directories, so
# an example works from any working directory. See plot_fisher_degeneracy.py
# for why the four-deep relative walk this replaces was a hazard.
filter_names = ["sdss_r", "2mass_j", "2mass_h"]
obs = tengri.Observation(photometry=tengri.Photometry.from_names(filter_names))

# Build a FIXED star-forming galaxy: constant SFR = 10 Msun/yr, age = 0.5 Gyr
# This matches a starburst or ongoing star-forming main-sequence galaxy.
model = tengri.SEDModel.build(
    ssp,
    observation=obs,
    sfh={
        "type": "tsnorm",  # Truncated normal SFH (analytic burst)
        "all_params": tengri.Fixed(tengri.DEFAULT),
        "log_total_mass": 10.0,  # peak SFR = 10 Msun/yr
        "peak_lbt_gyr": 0.5,  # peak at age = 0.5 Gyr lookback time
        "width_gyr": 0.2,  # narrow gaussian → bursty
        "skew": 0.0,
        "trunc": 13.0,  # extend to cosmic age
    },
    dust_attenuation={
        "law": "power_law",
        "type": "two_component",  # Adopted dust attenuation
        "all_params": tengri.Fixed(tengri.DEFAULT),
        "tau_diff": 0.3,  # diffuse attenuation optical depth
        "tau_bc": 0.5,  # birth-cloud attenuation
        "slope": -0.7,  # Calzetti-like slope
    },
    redshift=tengri.Fixed(tengri.DEFAULT),  # Will vary manually
)

# Sample baseline parameters once (deterministic)
baseline_params = dict(model.spec.sample(jax.random.PRNGKey(0)))


# Redshift grid: z = 0.1 to 6.0 in 30 steps (log-spaced for visibility at high z)
z_grid = np.linspace(0.1, 6.0, 30)

# Storage for flux measurements (one row per redshift, one column per band)
flux_observed = np.empty((len(z_grid), len(filter_names)))
flux_observed_normalized = np.empty_like(flux_observed)

# For each redshift, update the model and compute photometry
for i, z in enumerate(z_grid):
    # Build a new model instance with this redshift (only way to vary z post-build)
    z_model = tengri.SEDModel.build(
        ssp,
        observation=obs,
        sfh={
            "type": "tsnorm",
            "all_params": tengri.Fixed(tengri.DEFAULT),
            "log_total_mass": 10.0,
            "peak_lbt_gyr": 0.5,
            "width_gyr": 0.2,
            "skew": 0.0,
            "trunc": 13.0,
        },
        dust_attenuation={
            "law": "power_law",
            "type": "two_component",
            "all_params": tengri.Fixed(tengri.DEFAULT),
            "tau_diff": 0.3,
            "tau_bc": 0.5,
            "slope": -0.7,
        },
        redshift=tengri.Fixed(float(z)),
    )

    # ``z_model`` is already built with ``redshift=Fixed(float(z))`` above,
    # so its own params dict must OMIT "redshift" (#2296: a params-dict key
    # the spec declared Fixed is refused, even at the value it is already
    # pinned to). Passing it explicitly here was always redundant --
    # z_model resolves its own Fixed redshift internally.
    params = dict(baseline_params)

    # Predict observed-frame photometric flux [erg/s/cm^2/Hz]
    flux = np.asarray(z_model.predict_photometry(params))
    flux_observed[i, :] = flux

# Normalize to z = 0.1 for the bottom panel
flux_observed_normalized = flux_observed / flux_observed[0, :]

# Create figure with two subplots: raw flux and normalized
fig, (ax_flux, ax_norm) = plt.subplots(2, 1, figsize=(8, 7))

# Band colors and labels
colors = ["#CC0000", "#0066CC", "#00AA00"]
labels = ["SDSS r", "2MASS J", "2MASS H"]

# Top panel: observed F_ν vs redshift
for j, (color, label) in enumerate(zip(colors, labels)):
    ax_flux.semilogy(z_grid, flux_observed[:, j], "o-", color=color, lw=1.8, ms=4, label=label)

ax_flux.set_xlabel("Redshift z")
ax_flux.set_ylabel(r"Observed $F_\nu$ [erg s$^{-1}$ cm$^{-2}$ Hz$^{-1}$]")
ax_flux.legend(frameon=False, loc="upper right", fontsize=10)
ax_flux.grid(True, alpha=0.3, which="both")

# Bottom panel: normalized flux (K-correction + IGM effects isolated)
for j, (color, label) in enumerate(zip(colors, labels)):
    ax_norm.semilogy(
        z_grid, flux_observed_normalized[:, j], "s-", color=color, lw=1.8, ms=4, label=label
    )

ax_norm.set_xlabel("Redshift z")
ax_norm.set_ylabel(r"$F_\nu(z) / F_\nu(z=0.1)$")
ax_norm.legend(frameon=False, loc="upper left", fontsize=10)
ax_norm.grid(True, alpha=0.3, which="both")
ax_norm.axhline(y=1.0, color="gray", linestyle="--", alpha=0.5)

fig.tight_layout()
plt.savefig("plot_cosmic_dimming_observed_flux.png", dpi=150, bbox_inches="tight")
Total running time of the script: (0 minutes 4.239 seconds)