Note
Go to the end to download the full example code.
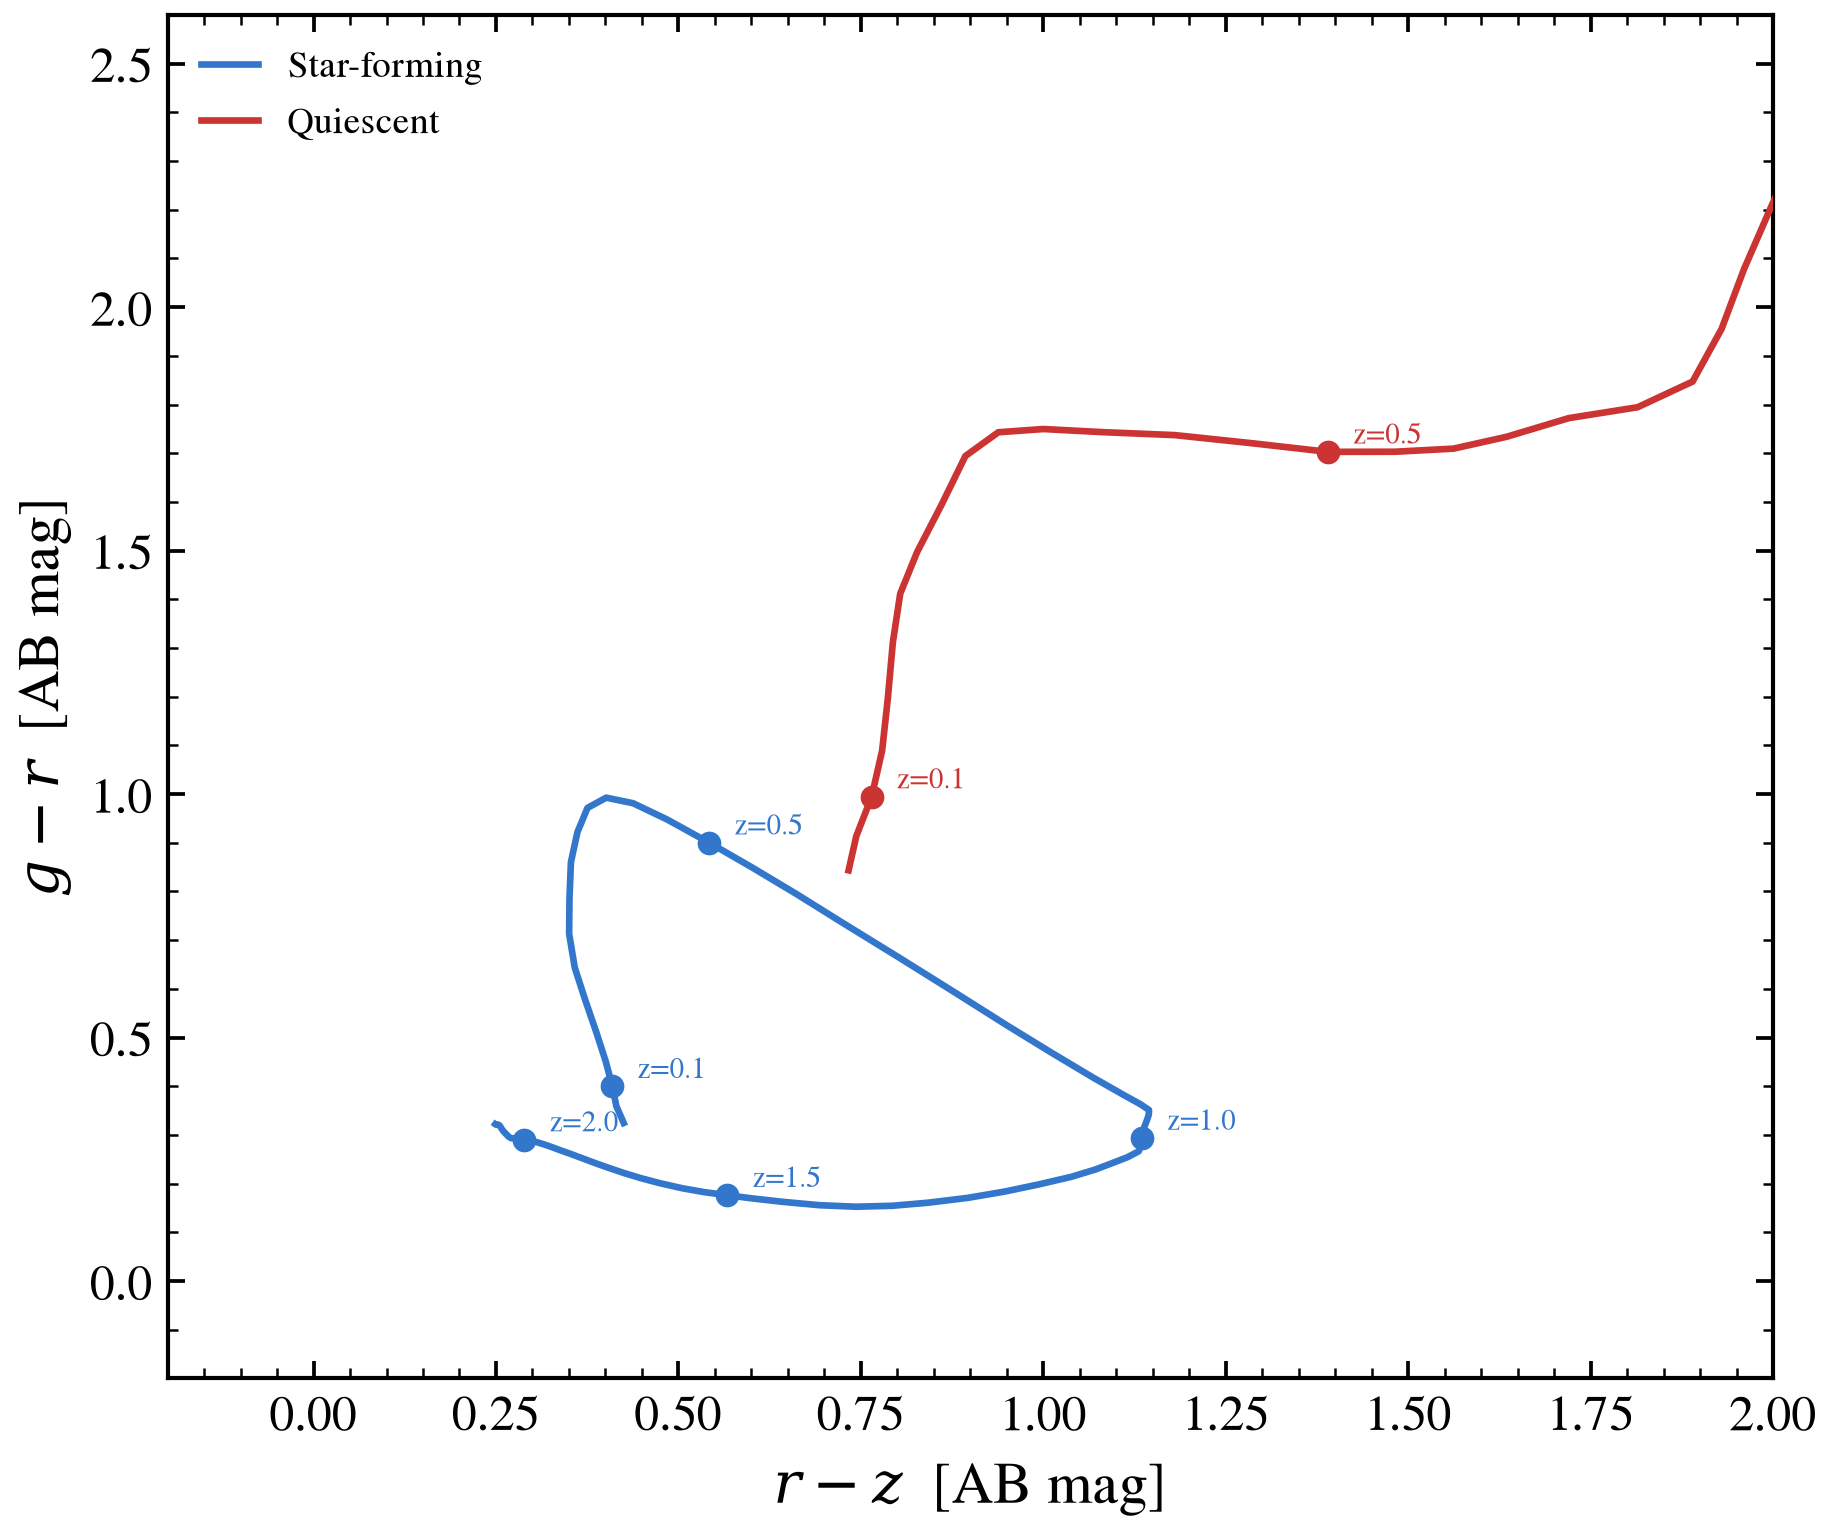
Photometric color tracks vs redshift
How does a galaxy’s location in color–color space evolve with
redshift? We compute SDSS g − r and r − z colors for two
galaxy populations — a young star-forming and an old quiescent —
across z = 0 to 3, with arrows marking the integer redshift
stops. This is the reference picture for photometric redshift
classifiers and for stellar-template grids.
Useful intuition this figure makes obvious:
the 4000 Å break sweeps from the u-g baseline at
z = 0into the r-z baseline byz ≳ 1.2the star-forming and quiescent tracks separate most at low z, then converge at high z as the break leaves all visible bands
the visible-band colors alone cannot distinguish a dusty z = 0.5 SF galaxy from an unobscured z = 3 LBG (the LBG dropout degeneracy demonstrated in workflows/plot_workflow_photoz_degeneracy)
import os

os.environ["TF_CPP_MIN_LOG_LEVEL"] = "2"  # suppress XLA/PjRt C++ INFO+WARNING logs

import warnings

import jax
import matplotlib.pyplot as plt
import numpy as np

import tengri
from tengri.plot import setup_style

setup_style()
warnings.filterwarnings("ignore", message=".*BakedInBackend.*")


def _flux(model, params):
    return np.asarray(model.predict_photometry(params))


obs = tengri.Observation(photometry=tengri.Photometry.from_names(["sdss_g", "sdss_r", "sdss_z"]))


def _build_population(peak_lbt, width, tau_diff):
    return tengri.SEDModel.build(
        tengri.load_ssp(),
        observation=obs,
        sfh={
            "type": "tsnorm",
            "all_params": tengri.Fixed(tengri.DEFAULT),
            "peak_lbt_gyr": peak_lbt,
            "width_gyr": width,
            "log_total_mass": 10.0,
            "skew": 0.0,
            "trunc": 13.0,
        },
        dust_attenuation={
            "law": "power_law",
            "type": "two_component",
            "all_params": tengri.Fixed(tengri.DEFAULT),
            "tau_diff": tau_diff,
            "tau_bc": 0.3,
            "slope": -0.7,
        },
        redshift=tengri.Uniform(0.001, 3.5),
    )


z_grid = np.linspace(0.05, 2.5, 80)

POPULATIONS = [
    ("Star-forming", 1.5, 2.5, 0.4, "#3377cc"),
    ("Quiescent", 9.0, 1.5, 0.05, "#cc3333"),
]

fig, ax = plt.subplots(figsize=(6.4, 5.4))
for label, peak, width, tau_diff, color in POPULATIONS:
    model = _build_population(peak, width, tau_diff)
    baseline = dict(model.spec.sample(jax.random.PRNGKey(0)))
    gr, rz = np.empty_like(z_grid), np.empty_like(z_grid)
    for i, z in enumerate(z_grid):
        params = {**baseline, "redshift": float(z)}
        flux = _flux(model, params)
        gr[i] = -2.5 * np.log10(flux[0] / flux[1])
        rz[i] = -2.5 * np.log10(flux[1] / flux[2])
    ax.plot(rz, gr, color=color, lw=1.6, label=label, zorder=3)

    for z_mark in [0.1, 0.5, 1.0, 1.5, 2.0]:
        i_m = int(np.argmin(np.abs(z_grid - z_mark)))
        ax.scatter(rz[i_m], gr[i_m], s=22, color=color, zorder=4)
        ax.annotate(
            f"z={z_mark:.1f}",
            (rz[i_m], gr[i_m]),
            textcoords="offset points",
            xytext=(6, 2),
            fontsize=7,
            color=color,
        )

ax.set(
    xlabel=r"$r - z$  [AB mag]", ylabel=r"$g - r$  [AB mag]", xlim=(-0.2, 2.0), ylim=(-0.2, 2.6)
)
ax.legend(frameon=False, fontsize=9, loc="upper left")

fig.tight_layout()
plt.savefig("plot_color_tracks_redshift.png", dpi=150, bbox_inches="tight")