Note
Go to the end to download the full example code.
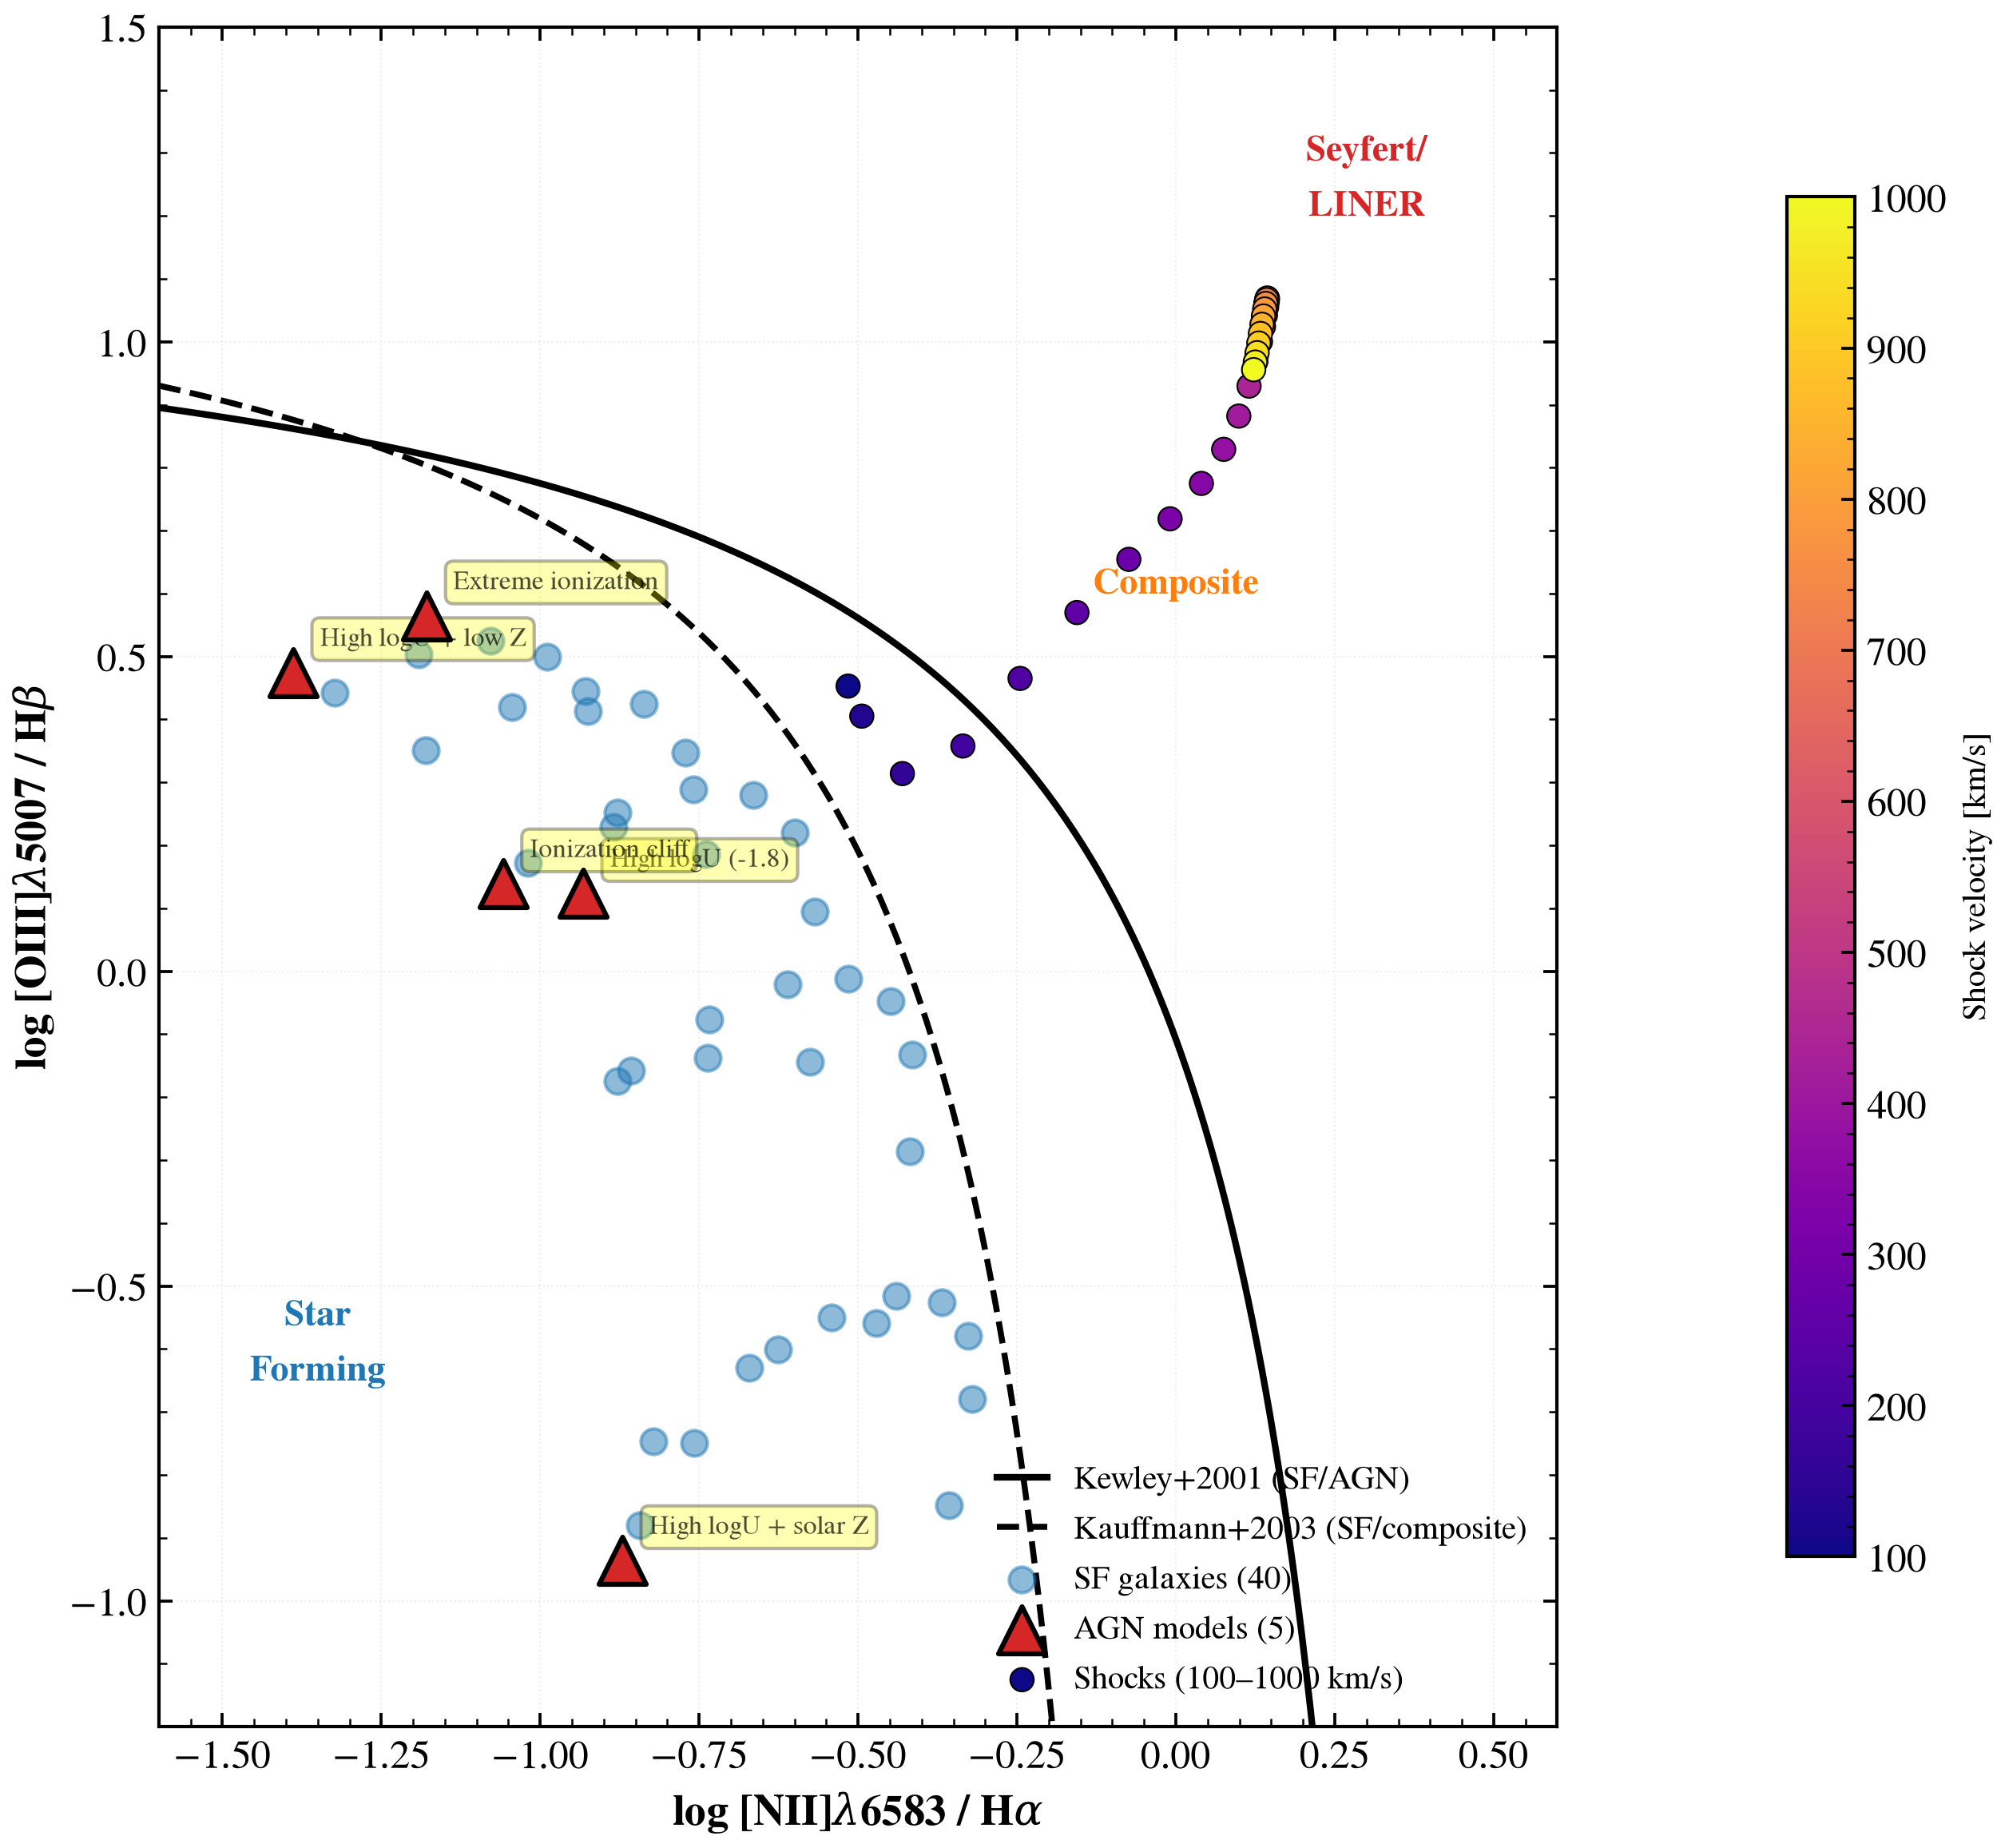
BPT diagram: star-forming galaxies, AGN, and shocks
Emission lines are vacuum throughout: [OIII] = 5008.24 Å, [NII] = 6585.28 Å, Hα = 6564.61 Å, Hβ = 4862.68 Å. Overlays Kewley+2001 SF/AGN demarcation and Kauffmann+2003 SF/composite line.
References
Baldwin et al. 1981, PASP, 93, 5 (BPT diagnostic definitions). Kewley et al. 2001, ApJ, 556, 121 (SF/AGN demarcation). Kauffmann et al. 2003, MNRAS, 346, 1055 (SF/composite line). Allen et al. 2008, ApJS, 178, 20 (MAPPINGS V shocks).
import os

os.environ["TF_CPP_MIN_LOG_LEVEL"] = "2"  # suppress XLA/PjRt C++ INFO+WARNING logs

import warnings

import jax
import matplotlib.pyplot as plt
import numpy as np

import tengri
from tengri.nebular import shock_line_ratios
from tengri.plot import setup_style

setup_style()
warnings.filterwarnings("ignore", message=".*BakedInBackend.*")
warnings.filterwarnings("ignore", message=".*deprecated.*")

# --- Load bare-stellar SSP (required for Cue) ---
ssp = tengri.load_ssp("fsps_prsc_miles_chabrier")

# --- Grid for BPT demarcation lines ---
log_nii_ha_grid = np.linspace(-1.6, 0.5, 300)

# Kewley+2001 maximum starburst line
log_oiii_hb_kewley = 0.61 / (log_nii_ha_grid - 0.47) + 1.19

# Kauffmann+2003 empirical SF line
log_oiii_hb_kauff = 0.61 / (log_nii_ha_grid - 0.05) + 1.3

# --- Generate mock star-forming catalog (40 galaxies) ---
# Sample logU and logZ_gas on a 2D grid to cover SF main sequence
n_logu = 5
n_logz = 8
logu_array = np.linspace(-3.5, -2.0, n_logu)
logz_array = np.linspace(-1.0, 0.3, n_logz)

sf_log_nii_ha = []
sf_log_oiii_hb = []

for logu in logu_array:
    for logz in logz_array:
        # Build a minimal star-forming model
        model = tengri.SEDModel.build(
            ssp,
            sfh={
                "type": "dpl",
                "all_params": tengri.Fixed(tengri.DEFAULT),
                "alpha": 1.0,
                "beta": 2.5,
                "tau_gyr": 0.1,
                "log_total_mass": 10.0,
            },
            dust_attenuation={
                "law": "power_law",
                "type": "two_component",
                "all_params": tengri.Fixed(tengri.DEFAULT),
                "tau_diff": 0.05,
                "tau_bc": 0.1,
            },
            neb={
                "type": "cue",
                "all_params": tengri.Fixed(tengri.DEFAULT),
                "logU": tengri.Fixed(logu),
                "logZ_gas": tengri.Fixed(logz),
            },
            redshift=tengri.Fixed(0.05),
        )

        params = dict(model.spec.sample(jax.random.PRNGKey(42)))
        lines = model.predict(params).lines

        if lines is not None:
            ha = float(lines.halpha)
            hb = float(lines.hbeta)
            nii = float(lines.nii_6584)
            oiii = float(lines.oiii_5007)

            if ha > 0 and hb > 0 and nii > 0 and oiii > 0:
                log_nii_ha = np.log10(nii / ha)
                log_oiii_hb = np.log10(oiii / hb)
                sf_log_nii_ha.append(log_nii_ha)
                sf_log_oiii_hb.append(log_oiii_hb)

sf_log_nii_ha = np.array(sf_log_nii_ha)
sf_log_oiii_hb = np.array(sf_log_oiii_hb)

# --- Generate AGN-like models via high ionization + low metallicity ---
# Since AGN composite is still under development, simulate AGN loci by using
# extreme ionization parameters (high logU) and low metallicity
agn_configs = [
    {"name": "High logU (-1.8)", "logu": -1.8, "logz": 0.0},
    {"name": "High logU + low Z", "logu": -1.8, "logz": -1.0},
    {"name": "Extreme ionization", "logu": -1.5, "logz": -0.5},
    {"name": "High logU + solar Z", "logu": -1.8, "logz": 0.3},
    {"name": "Ionization cliff", "logu": -1.2, "logz": 0.0},
]

agn_log_nii_ha = []
agn_log_oiii_hb = []
agn_labels = []

for config in agn_configs:
    # Build high-ionization model
    model = tengri.SEDModel.build(
        ssp,
        sfh={
            "type": "dpl",
            "all_params": tengri.Fixed(tengri.DEFAULT),
            "alpha": 1.0,
            "beta": 2.0,
            "tau_gyr": 0.15,
            "log_total_mass": 10.0,
        },
        dust_attenuation={
            "law": "power_law",
            "type": "two_component",
            "all_params": tengri.Fixed(tengri.DEFAULT),
            "tau_diff": 0.1,
            "tau_bc": 0.2,
        },
        neb={
            "type": "cue",
            "all_params": tengri.Fixed(tengri.DEFAULT),
            "logU": tengri.Fixed(config["logu"]),
            "logZ_gas": tengri.Fixed(config["logz"]),
        },
        redshift=tengri.Fixed(0.05),
    )

    params = dict(model.spec.sample(jax.random.PRNGKey(123)))
    lines = model.predict(params).lines

    if lines is not None:
        ha = float(lines.halpha)
        hb = float(lines.hbeta)
        nii = float(lines.nii_6584)
        oiii = float(lines.oiii_5007)

        if ha > 0 and hb > 0 and nii > 0 and oiii > 0:
            log_nii_ha = np.log10(nii / ha)
            log_oiii_hb = np.log10(oiii / hb)
            agn_log_nii_ha.append(log_nii_ha)
            agn_log_oiii_hb.append(log_oiii_hb)
            agn_labels.append(config["name"])

agn_log_nii_ha = np.array(agn_log_nii_ha)
agn_log_oiii_hb = np.array(agn_log_oiii_hb)

# --- Generate shock sequence (MAPPINGS V, 100–1000 km/s) ---
velocities = np.linspace(100.0, 1000.0, 30)
shock_nii_ha = []
shock_oiii_hb = []
shock_velocities = []
for v in velocities:
    r = shock_line_ratios(float(v))
    ha = float(r["HA_6563A"])
    hb = float(r.get("Hb_4861A", ha / 2.86))
    nii = float(r["NII_6583A"])
    oiii = float(r["O3_5007A"])
    if ha > 0 and hb > 0 and nii > 0 and oiii > 0:
        shock_nii_ha.append(np.log10(nii / ha))
        shock_oiii_hb.append(np.log10(oiii / hb))
        shock_velocities.append(v)

shock_nii_ha = np.array(shock_nii_ha)
shock_oiii_hb = np.array(shock_oiii_hb)
shock_velocities = np.array(shock_velocities)

# --- Plot BPT diagram ---
fig, ax = plt.subplots(figsize=(9, 8))

# Demarcation lines
mask_k = log_nii_ha_grid < 0.47
ax.plot(
    log_nii_ha_grid[mask_k], log_oiii_hb_kewley[mask_k], "k-", lw=2.0, label="Kewley+2001 (SF/AGN)"
)
mask_kauff = log_nii_ha_grid < 0.05
ax.plot(
    log_nii_ha_grid[mask_kauff],
    log_oiii_hb_kauff[mask_kauff],
    "k--",
    lw=1.8,
    label="Kauffmann+2003 (SF/composite)",
)

# Region labels
ax.text(
    -1.35, -0.65, "Star\nForming", fontsize=11, color="#1f77b4", fontweight="bold", ha="center"
)
ax.text(0.0, 0.6, "Composite", fontsize=11, color="#ff7f0e", fontweight="bold", ha="center")
ax.text(0.3, 1.2, "Seyfert/\nLINER", fontsize=11, color="#d62728", fontweight="bold", ha="center")

# Plot star-forming galaxy population
ax.scatter(
    sf_log_nii_ha,
    sf_log_oiii_hb,
    s=60,
    c="#1f77b4",
    alpha=0.5,
    edgecolors="#1f77b4",
    lw=1.0,
    label="SF galaxies (40)",
)

# Plot AGN models (larger markers)
ax.scatter(
    agn_log_nii_ha,
    agn_log_oiii_hb,
    s=200,
    marker="^",
    c="#d62728",
    edgecolors="black",
    lw=1.5,
    label="AGN models (5)",
    zorder=10,
)

# Plot shock sequence (MAPPINGS V)
if len(shock_velocities) > 0:
    sc = ax.scatter(
        shock_nii_ha,
        shock_oiii_hb,
        c=shock_velocities,
        cmap="plasma",
        s=50,
        zorder=5,
        label="Shocks (100–1000 km/s)",
        edgecolors="black",
        lw=0.5,
    )
    cbar_shock = plt.colorbar(sc, ax=ax, pad=0.12, shrink=0.8)
    cbar_shock.set_label("Shock velocity [km/s]", fontsize=10)

# Label AGN points
for x, y, label in zip(agn_log_nii_ha, agn_log_oiii_hb, agn_labels):
    ax.annotate(
        label,
        (x, y),
        xytext=(8, 8),
        textcoords="offset points",
        fontsize=8,
        alpha=0.7,
        bbox=dict(boxstyle="round,pad=0.3", facecolor="yellow", alpha=0.3),
    )

ax.set_xlabel(r"log [NII]$\lambda$6583 / H$\alpha$", fontsize=13, fontweight="bold")
ax.set_ylabel(r"log [OIII]$\lambda$5007 / H$\beta$", fontsize=13, fontweight="bold")
ax.set_xlim(-1.6, 0.6)
ax.set_ylim(-1.2, 1.5)
ax.legend(fontsize=10, frameon=False, loc="lower right", ncol=1)
ax.grid(True, alpha=0.2, linestyle=":")

fig.tight_layout()
plt.savefig("plot_bpt_diagram_population.png", dpi=150, bbox_inches="tight")
Total running time of the script: (0 minutes 9.422 seconds)