Note
Go to the end to download the full example code.
DLA damping wing evolves with absorber redshift at fixed column density
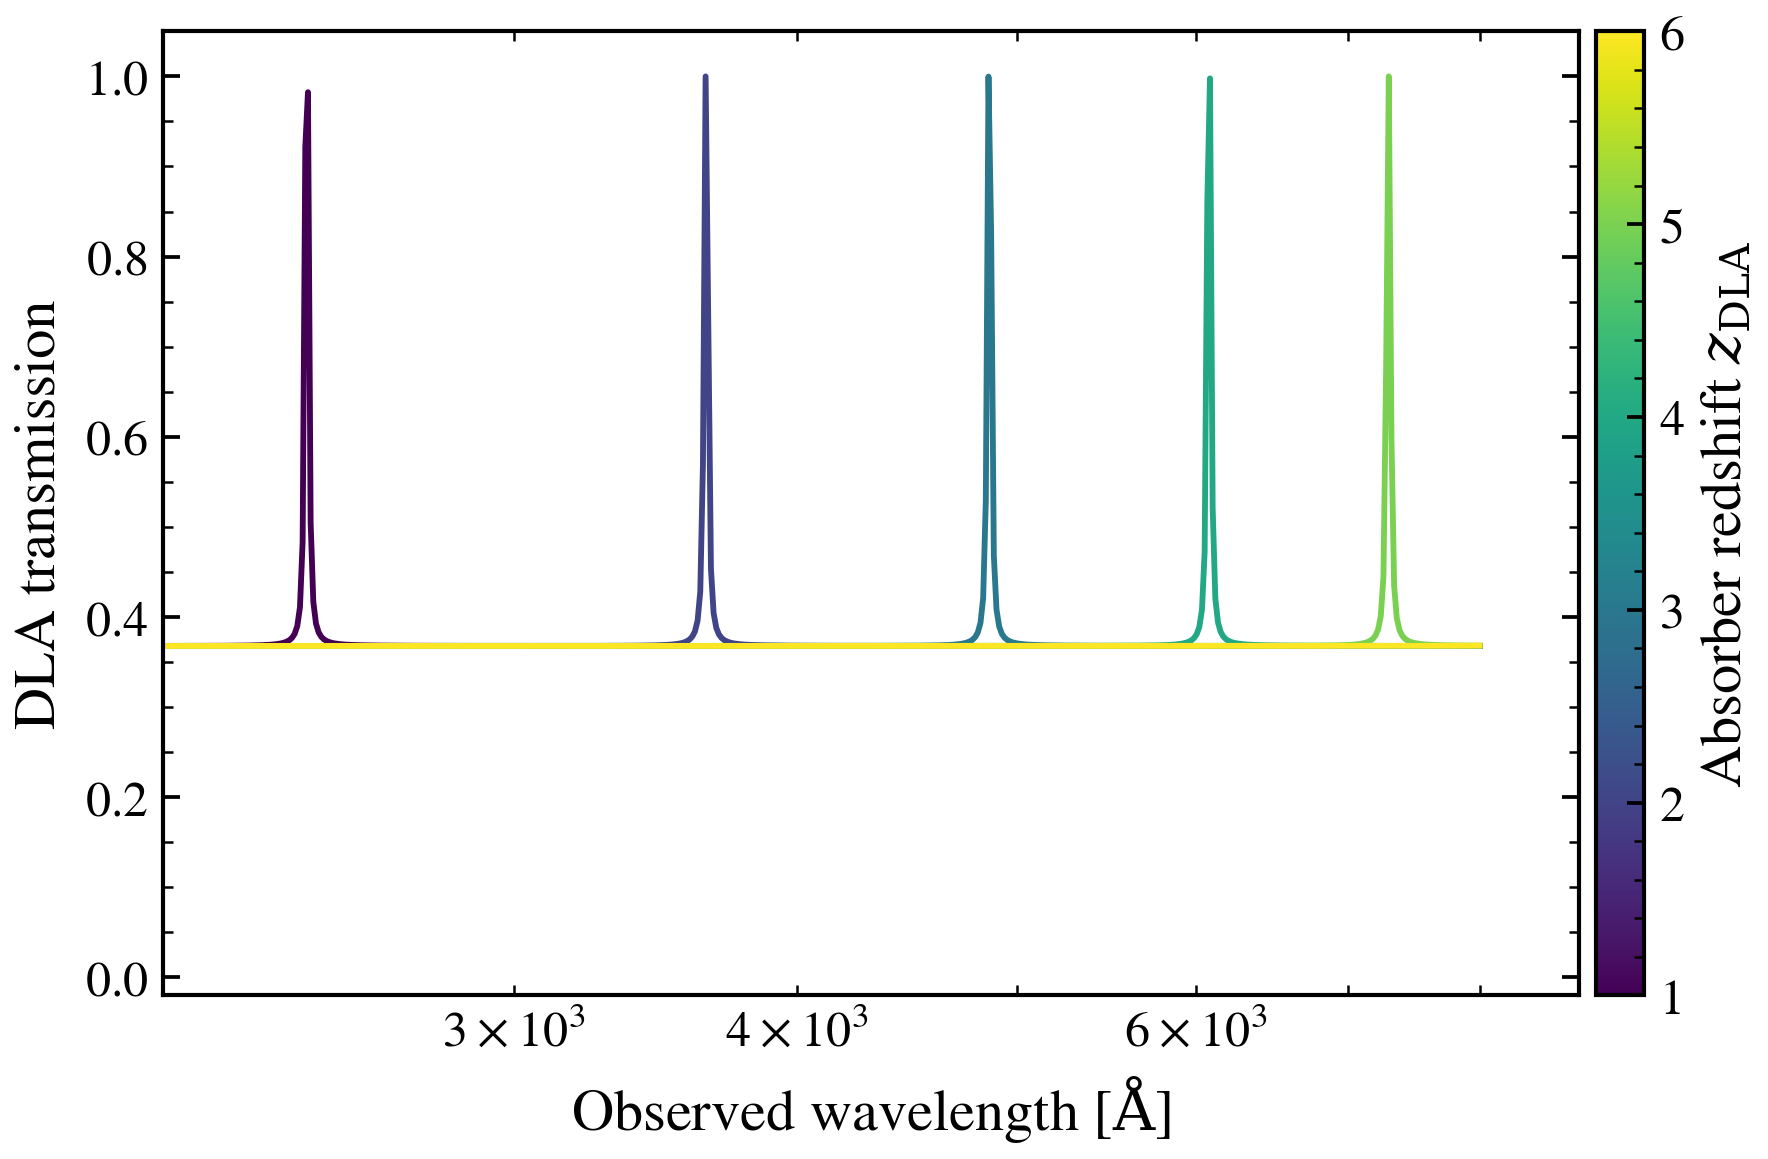
Damped Lyman-alpha (DLA) systems imprint deep absorption troughs across the UV-to-optical range, with the strength and profile shape depending sensitively on the absorber’s redshift. We hold column density at the classic DLA threshold log(N_H) = 20.3 cm⁻² and sweep the absorber redshift over z ∈ {1, 2, 3, 4, 5, 6}, showing how the damping wing pattern shifts to longer observed wavelengths and the Lyman-alpha forest structure evolves. This complements the fixed-z, variable-N_H absorption pattern by isolating the redshift dependence.
Reference: Wolfe et al. 2005, ARA&A, 43, 861 (DLA review and cross-sections).
import os

os.environ["TF_CPP_MIN_LOG_LEVEL"] = "2"  # suppress XLA/PjRt C++ INFO+WARNING logs

import warnings

import jax.numpy as jnp
import matplotlib as mpl
import matplotlib.pyplot as plt
import numpy as np

from tengri.igm import dla_transmission_obs
from tengri.plot import setup_style

setup_style()
warnings.filterwarnings("ignore", message=".*BakedInBackend.*")

# Fixed column density at DLA threshold
log_nh = 20.3

# Sweep absorber redshift
z_dla_values = np.array([1.0, 2.0, 3.0, 4.0, 5.0, 6.0])
norm = mpl.colors.Normalize(vmin=z_dla_values.min(), vmax=z_dla_values.max())
cmap = plt.get_cmap("viridis")

# Observed-frame wavelength grid: UV to optical
wavelength_obs = jnp.logspace(np.log10(500), np.log10(8000), 1024)

fig, ax = plt.subplots(figsize=(6.5, 4.2))
for z_dla in z_dla_values:
    tau_dla = dla_transmission_obs(wavelength_obs, z_dla=z_dla, log_n_hi=log_nh)
    transmission = jnp.exp(-tau_dla)
    ax.plot(np.array(wavelength_obs), np.array(transmission), color=cmap(norm(z_dla)), lw=1.4)

# Zoom to show the Lyman-alpha damping-wing evolution across redshift
# At z=1, Lya is at 2432 Å; at z=6, Lya is at 8512 Å
# Zoom to focus on the damping trough march, with ±300 Å padding on each end
ax.set_xlim(2100, 8850)
ax.set_xscale("log")
ax.set_ylim(-0.02, 1.05)
ax.set_xlabel(r"Observed wavelength [$\mathrm{\AA}$]")
ax.set_ylabel("DLA transmission")

cbar = fig.colorbar(plt.cm.ScalarMappable(norm=norm, cmap=cmap), ax=ax, pad=0.01)
cbar.set_label(r"Absorber redshift $z_{\mathrm{DLA}}$")

fig.tight_layout()
plt.savefig("plot_dla_redshift_evolution.png", dpi=150, bbox_inches="tight")