Note
Go to the end to download the full example code.
Dust IR SED: Warm and cold dust decomposition
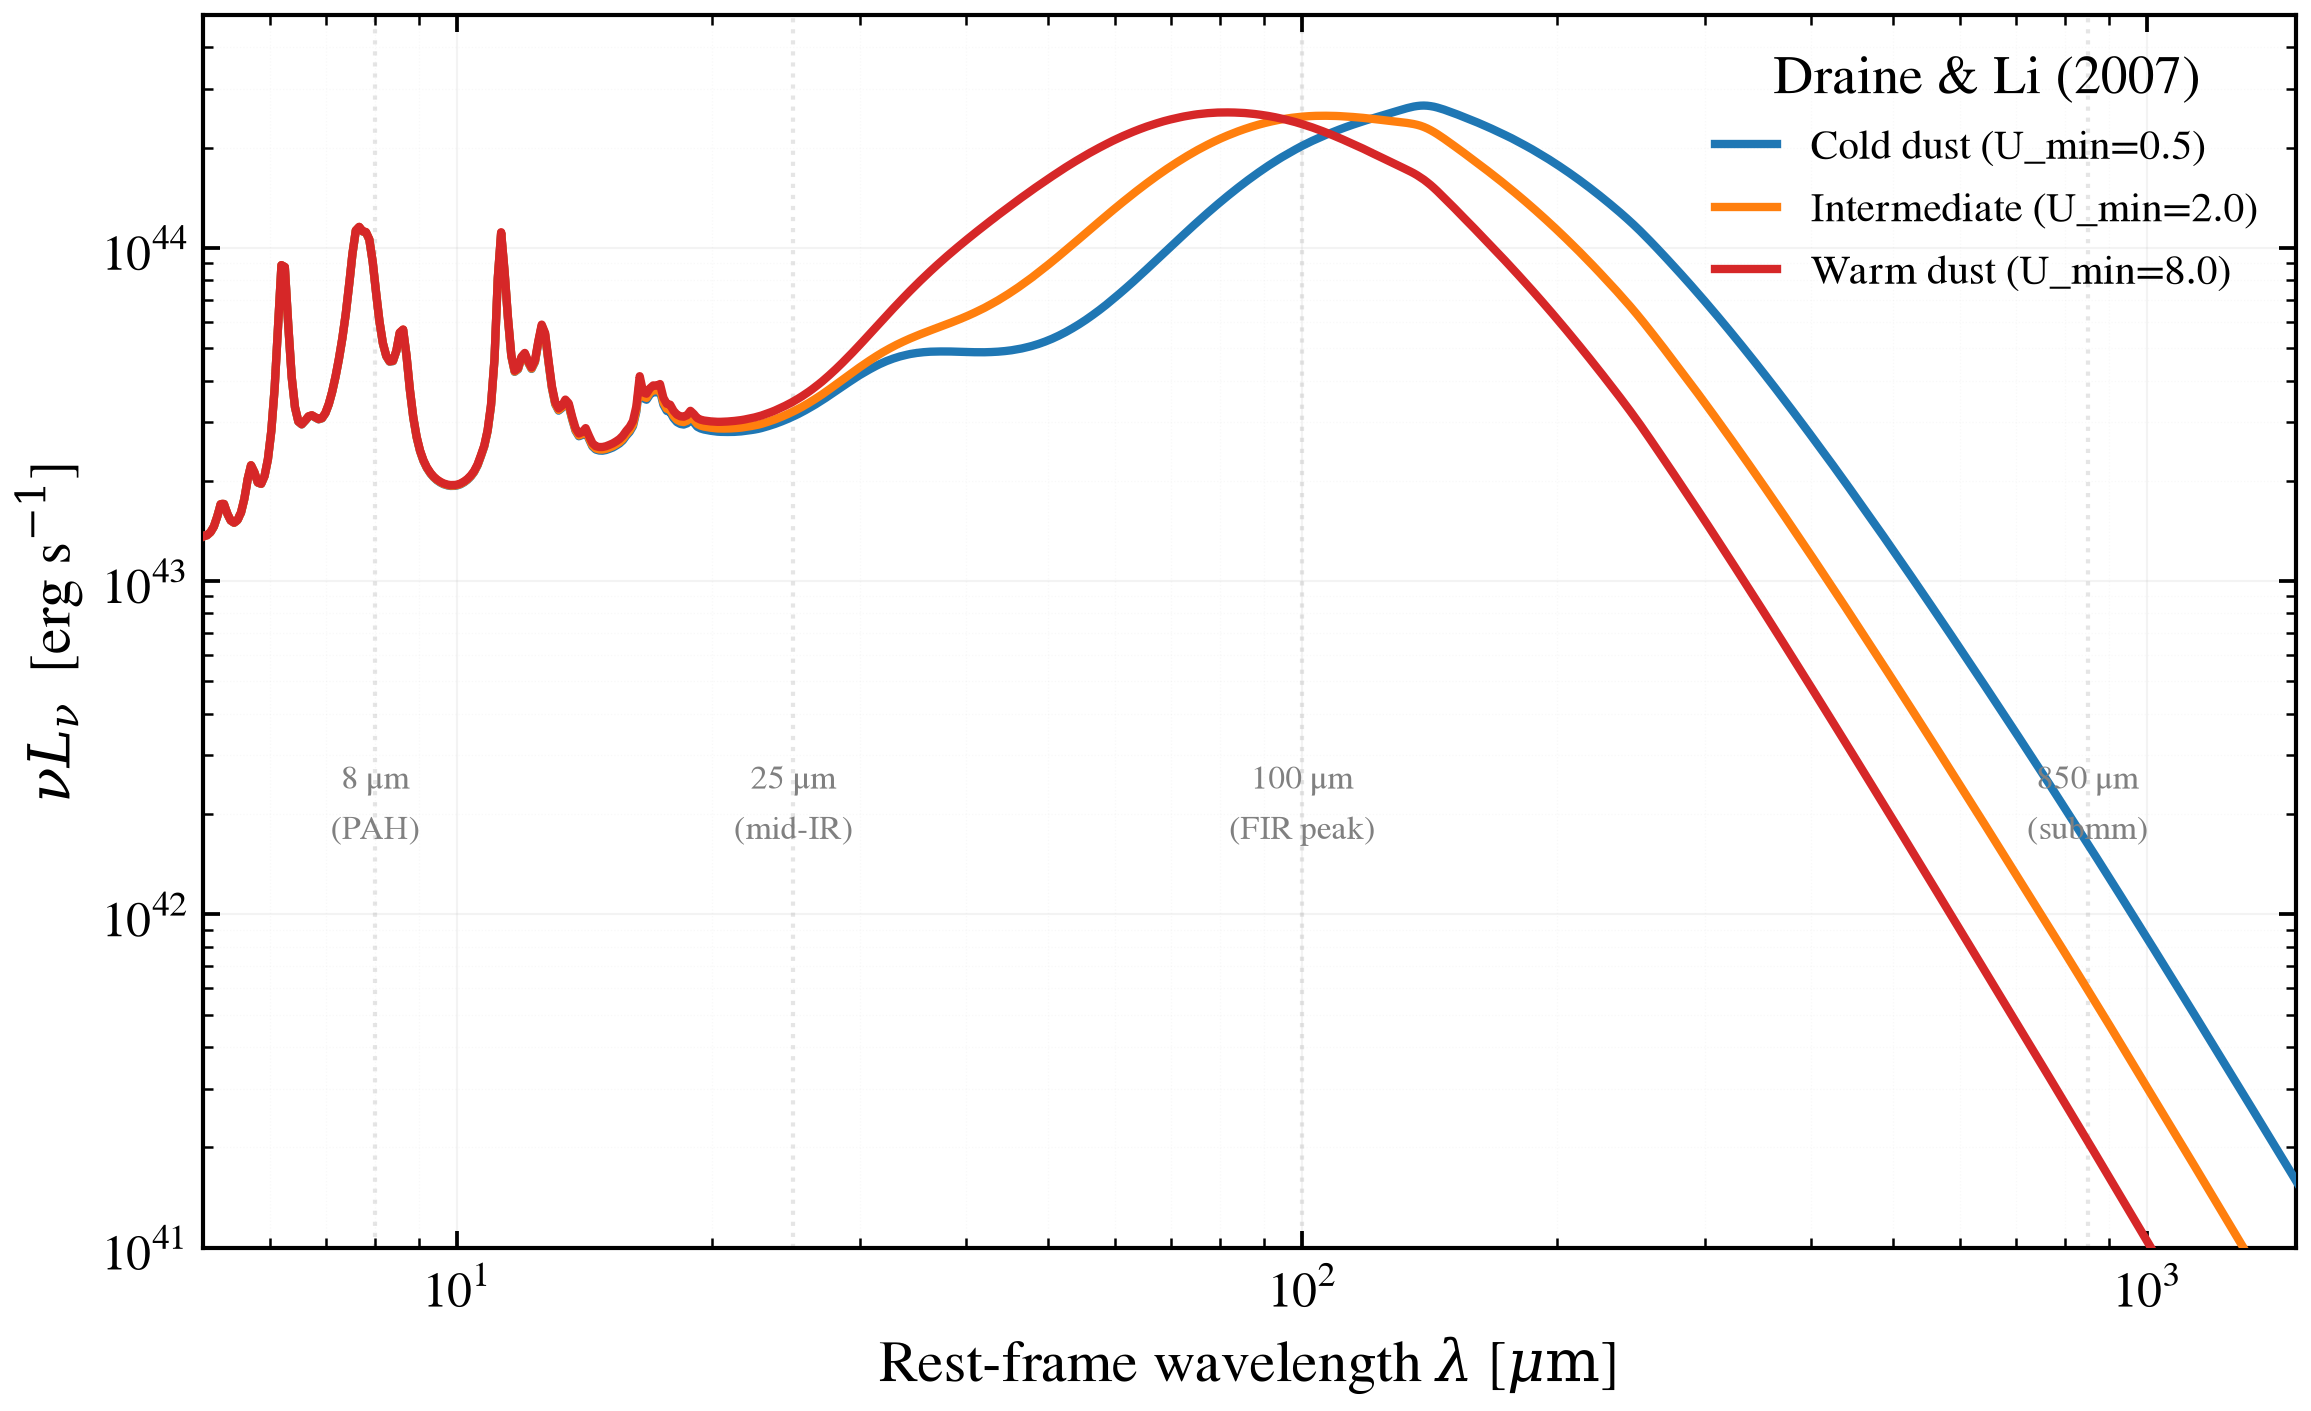
Dust re-radiates absorbed starlight across a broad range of temperatures: colder dust (e.g., diffuse cirrus at ~20 K) peaks in the far-infrared (~250 μm), while warmer dust grains (e.g., starburst regions at ~40 K) peak at shorter wavelengths (~50–100 μm).
the U_min parameter of the Draine & Li
(2007) dust emission model controls the balance between warm and cold
grain populations. By varying dust_umin while holding dust_qpah
fixed, we show the dust temperature decomposition:
U_min = 0.5 → Colder dust population dominates (peak ~250 μm, T ≈ 20 K)
U_min = 2.0 → Intermediate regime (peak ~100 μm, T ≈ 35 K)
U_min = 8.0 → Warmer dust grains dominate (peak ~50 μm, T ≈ 50+ K)
The radiation field intensity (U_min) directly sets the hardness of the incident stellar radiation and thus the equilibrium temperature of dust grains. Higher U_min produces a harder radiation field, heating smaller grains to higher temperatures. The mid-infrared PAH contrast also increases with U_min due to enhanced UV/optical heating of PAH molecules.
References
import os

os.environ["TF_CPP_MIN_LOG_LEVEL"] = "2"  # suppress XLA/PjRt C++ INFO+WARNING logs

import warnings

import jax
import jax.numpy as jnp
import matplotlib.pyplot as plt
import numpy as np

import tengri
from tengri.plot import setup_style

setup_style()
warnings.filterwarnings("ignore", message=".*BakedInBackend.*")

# Physical constant: c in AA/s
C_AA_PER_S = 2.998e18

# Load default bare-stellar SSP (required for Cue nebular backend)
ssp = tengri.load_ssp()


def _build_model(u_min: float) -> tuple:
    """
    Build a SEDModel with two-component dust and DL07 emission.

    Constructs a model with:
    - Constant SFR (SFH family: 'const')
    - Two-component dust attenuation (Calzetti BC law + DL07 emission)
    - Fixed redshift (z = 0.05)
    - All parameters fixed except dust_umin (which we vary)

    Parameters
    ----------
    u_min : float
        Minimum radiation field intensity [dex relative to local MW field].
        Controls equilibrium dust temperature.

    Returns
    -------
    model : tengri.SEDModel
        The constructed model.
    params : dict
        Parameter dictionary with dust_umin set to the specified value.
        Other parameters sampled from priors.
    """
    dust_config = {
        "law": "power_law",
        "type": "two_component",
        "all_params": tengri.Fixed(tengri.DEFAULT),
        "tau_diff": 1.0,
        "tau_bc": 0.3,
    }
    dust_emission = {
        "type": "draine_li2007",
        "all_params": tengri.Fixed(tengri.DEFAULT),
        "qpah": 2.5,  # Fixed PAH mass fraction
        "umin": tengri.Uniform(0.5, 8.0),  # Promote to FREE: varies across regimes
    }

    model = tengri.SEDModel.build(
        ssp,
        sfh={"type": "const", "all_params": tengri.Fixed(tengri.DEFAULT), "log_total_mass": 11.0},
        dust_attenuation=dust_config,
        dust_emission=dust_emission,
        redshift=tengri.Fixed(0.05),
    )

    # Sample parameters from priors, then override dust_umin
    params = dict(model.spec.sample(jax.random.PRNGKey(0)))
    params["dust_umin"] = jnp.float64(u_min)

    return model, params


def _compute_νlν(wavelength, l_nu):
    """
    Convert rest-frame L_ν to νL_ν for plotting.

    Parameters
    ----------
    wavelength : array_like
        Rest-frame wavelength in Angstrom.
    l_nu : array_like
        Rest-frame spectral luminosity L_ν [erg s^-1 Hz^-1].

    Returns
    -------
    nu_l_nu : ndarray
        νL_ν in erg s^-1.
    """
    return C_AA_PER_S / wavelength * l_nu


# ============================================================================
# Three dust temperature regimes: vary U_min at fixed q_PAH
# ============================================================================

regimes = {
    "Cold dust (U_min=0.5)": {"u_min": 0.5},
    "Intermediate (U_min=2.0)": {"u_min": 2.0},
    "Warm dust (U_min=8.0)": {"u_min": 8.0},
}

# Colors for visual distinction
colors = {
    "Cold dust (U_min=0.5)": "#1f77b4",  # blue
    "Intermediate (U_min=2.0)": "#ff7f0e",  # orange
    "Warm dust (U_min=8.0)": "#d62728",  # red
}

# ============================================================================
# Build and predict
# ============================================================================

fig, ax = plt.subplots(figsize=(8.0, 5.0))

wavelength_peaks = {}

for regime_name, params_dict in regimes.items():
    # Build model and predict
    model, params = _build_model(u_min=params_dict["u_min"])
    prediction = model.predict(params)

    # Extract and convert to νL_ν
    wave_aa = np.asarray(model.wavelengths)
    l_nu = np.asarray(prediction.rest_sed())
    nu_l_nu = _compute_νlν(wave_aa, l_nu)

    # Convert to microns for diagnostic lines
    wave_um = wave_aa / 1e4

    # Plot
    ax.loglog(
        wave_um,
        nu_l_nu,
        color=colors[regime_name],
        lw=2.0,
        label=regime_name,
        zorder=3,
    )

    # Track peak for text placement
    idx_peak = np.argmax(nu_l_nu[wave_um > 8])
    peak_wave_um = wave_um[wave_um > 8][idx_peak]
    peak_nu_l_nu = nu_l_nu[wave_um > 8][idx_peak]
    wavelength_peaks[regime_name] = (peak_wave_um, peak_nu_l_nu)

# ============================================================================
# Diagnostic wavelength lines
# ============================================================================

# PAH complex (8 μm)
ax.axvline(8.0, color="0.80", lw=1.0, alpha=0.5, linestyle=":", zorder=1)
ax.text(8.0, 1.5e42, "8 μm\n(PAH)", fontsize=8, color="0.5", ha="center", va="bottom")

# Mid-infrared (25 μm)
ax.axvline(25.0, color="0.80", lw=1.0, alpha=0.5, linestyle=":", zorder=1)
ax.text(25.0, 1.5e42, "25 μm\n(mid-IR)", fontsize=8, color="0.5", ha="center", va="bottom")

# Far-infrared anchor (100 μm)
ax.axvline(100.0, color="0.80", lw=1.0, alpha=0.5, linestyle=":", zorder=1)
ax.text(100.0, 1.5e42, "100 μm\n(FIR peak)", fontsize=8, color="0.5", ha="center", va="bottom")

# Submillimeter (850 μm)
ax.axvline(850.0, color="0.80", lw=1.0, alpha=0.5, linestyle=":", zorder=1)
ax.text(850.0, 1.5e42, "850 μm\n(submm)", fontsize=8, color="0.5", ha="center", va="bottom")

# ============================================================================
# Axes and labels
# ============================================================================

ax.set(
    xlim=(5.0, 1500),
    ylim=(1e41, 5e44),
    xlabel=r"Rest-frame wavelength $\lambda$ [$\mu\mathrm{m}$]",
    ylabel=r"$\nu L_\nu$  [erg s$^{-1}$]",
)

ax.legend(frameon=False, fontsize=10, loc="upper right", title="Draine & Li (2007)")

# Add grid for readability
ax.grid(True, which="both", alpha=0.15, linestyle="-", linewidth=0.5)
ax.grid(True, which="minor", alpha=0.08, linestyle=":", linewidth=0.3)

# ============================================================================
# Save
# ============================================================================

fig.tight_layout()
plt.savefig("plot_warm_cold_dust_decomposition.png", dpi=150, bbox_inches="tight")
Total running time of the script: (0 minutes 4.149 seconds)