Note
Go to the end to download the full example code.
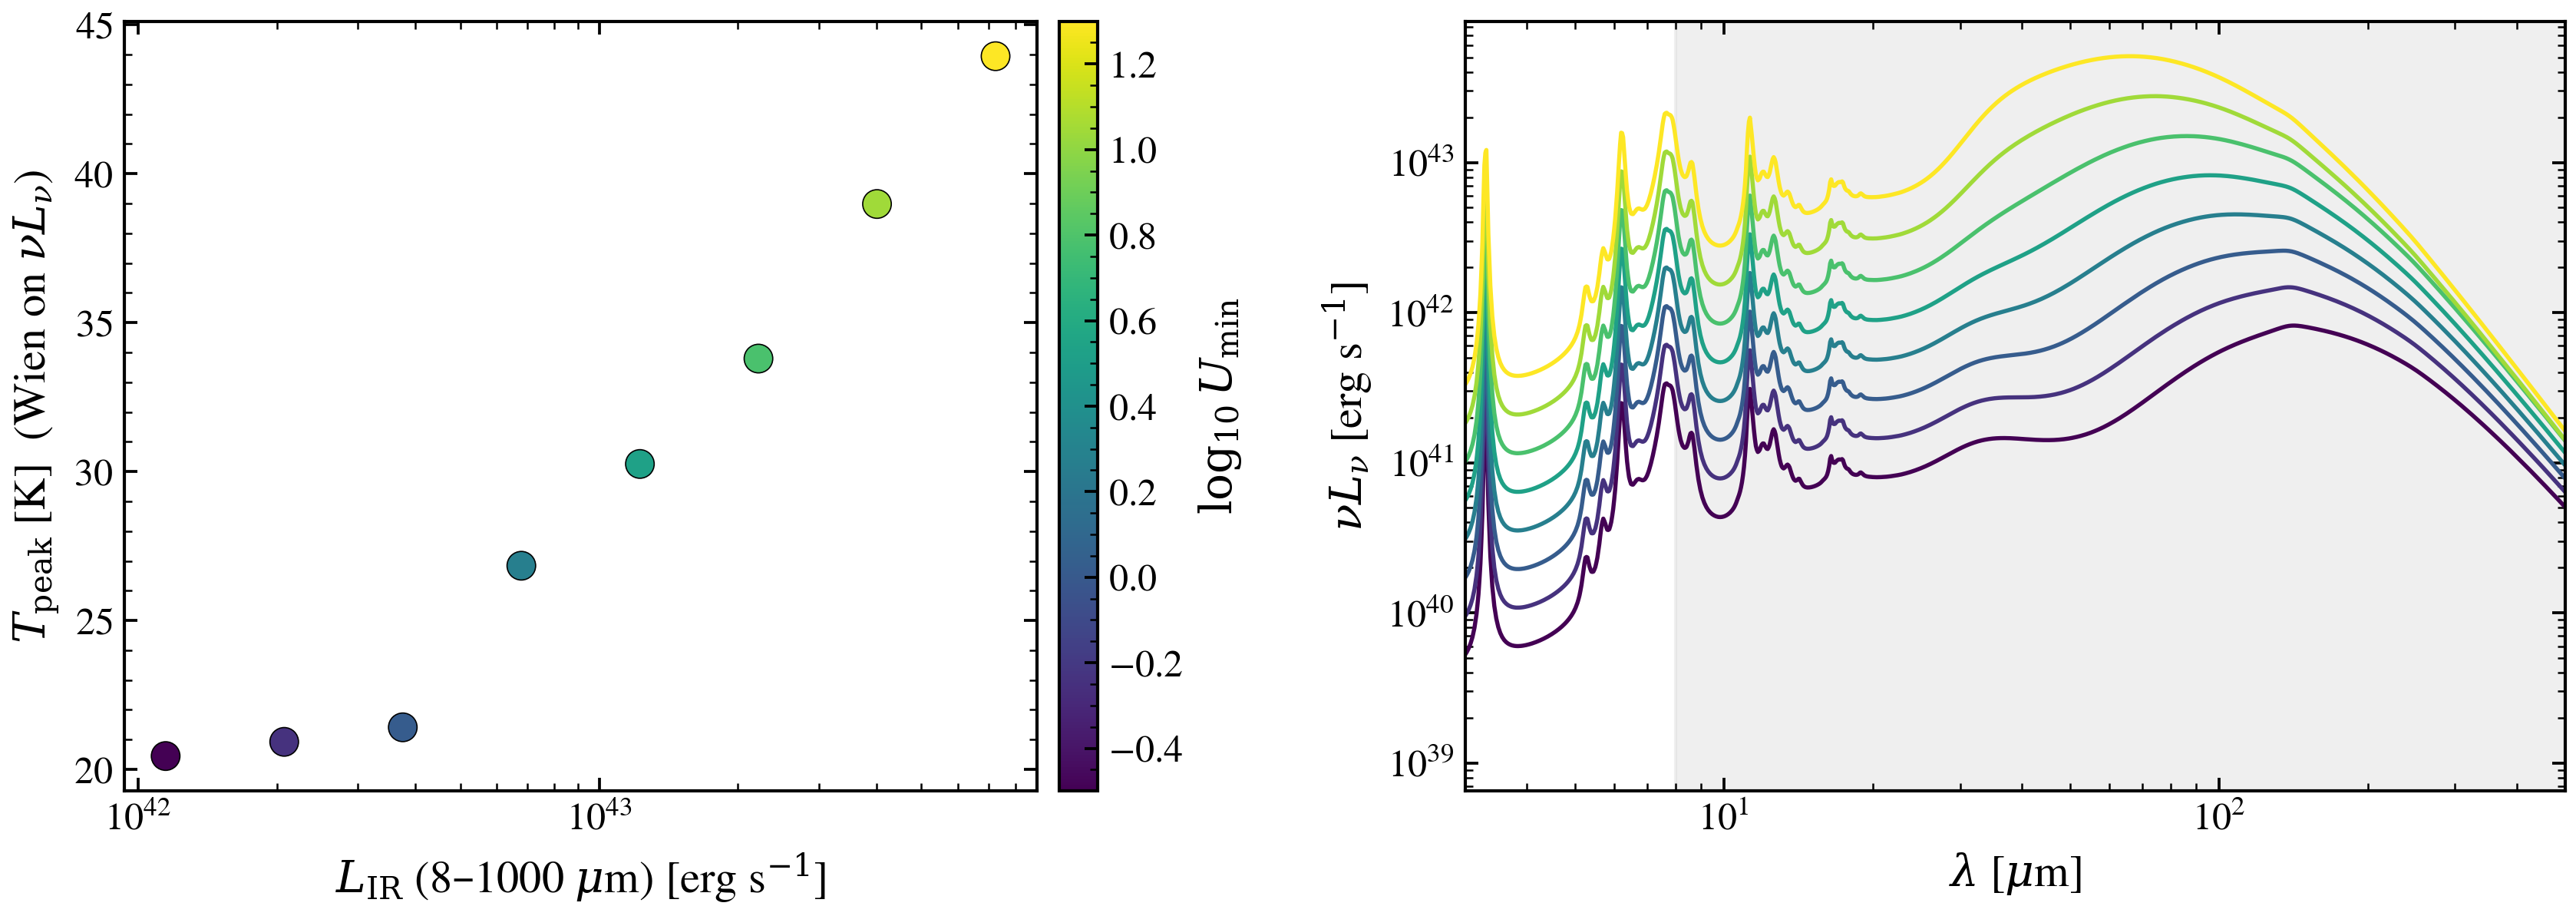
Radiation field strength sets both dust peak temperature and L_IR¶
For Draine & Li (2007) dust at fixed mass, raising the diffuse
radiation field intensity U_min does two things at once: it
shifts the SED peak blueward (warmer dust) and proportionally
boosts the total far-IR luminosity (L_IR ∝ U_min).
The standard T_peak–L_IR correlation seen in observations
is the joint footprint of these two effects.
We sweep U_min over the range typical of normal-to-starburst
galaxies, compute T_peak from νL_ν via Wien’s displacement
law, and L_IR by integrating L_ν over 8–1000 μm.
Reference: Draine & Li 2007, ApJ 657, 810 (Eq. 23, U distribution).
import warnings

import jax.numpy as jnp
import matplotlib.pyplot as plt
import numpy as np

from tengri.dust import draine_li2007
from tengri.plot import setup_style

setup_style()
warnings.filterwarnings("ignore")

C_AA_S = 2.998e18  # Å/s
L_SUN = 3.828e33  # erg/s
WIEN_UM_K = 2898.0  # Wien's constant in μm·K

wave_aa = jnp.logspace(4, 7, 1500)  # 1 - 1000 μm
wave_um = np.asarray(wave_aa) * 1e-4
nu = C_AA_S / np.asarray(wave_aa)

umin_vals = np.logspace(-0.5, 1.3, 8)  # 0.3 - 20

# At fixed dust mass, L_absorbed = U_min * L_abs_0  (DL07 §3.2)
L_ABS_0 = 1e9 * L_SUN
T_peak, L_IR, seds = [], [], []
for u in umin_vals:
    L_nu = np.asarray(
        draine_li2007(wave_aa, u * L_ABS_0, dust_umin=u, dust_gamma_dl=0.01, dust_qpah=2.5)
    )
    seds.append(L_nu)
    # νL_ν peak → Wien T
    ipk = int(np.argmax(nu * L_nu))
    T_peak.append(WIEN_UM_K / wave_um[ipk])
    # L_IR = ∫L_ν dν over 8-1000 μm (integrate over frequency, decreasing in λ)
    mask = (wave_um >= 8.0) & (wave_um <= 1000.0)
    order = np.argsort(nu[mask])
    L_IR.append(float(np.trapezoid(L_nu[mask][order], nu[mask][order])))

T_peak = np.array(T_peak)
L_IR = np.array(L_IR)

fig, (ax_corr, ax_sed) = plt.subplots(1, 2, figsize=(11.5, 4.3))
cmap = plt.get_cmap("viridis")
norm = plt.Normalize(np.log10(umin_vals.min()), np.log10(umin_vals.max()))

ax_corr.scatter(
    L_IR, T_peak, c=np.log10(umin_vals), cmap=cmap, s=80, edgecolor="k", lw=0.4, zorder=3
)
ax_corr.set(
    xscale="log",
    xlabel=r"$L_{\rm IR}$ (8–1000 $\mu$m) [erg s$^{-1}$]",
    ylabel=r"$T_{\rm peak}$ [K]  (Wien on $\nu L_\nu$)",
)
cb = fig.colorbar(plt.cm.ScalarMappable(norm=norm, cmap=cmap), ax=ax_corr, pad=0.02)
cb.set_label(r"$\log_{10} U_{\rm min}$")

for u, L_nu in zip(umin_vals, seds):
    ax_sed.loglog(wave_um, nu * L_nu, color=cmap(norm(np.log10(u))), lw=1.3)
ax_sed.set(xlim=(3, 500), xlabel=r"$\lambda$ [$\mu$m]", ylabel=r"$\nu L_\nu$ [erg s$^{-1}$]")
ax_sed.axvspan(8, 1000, color="0.85", alpha=0.4, zorder=0)

fig.tight_layout()
plt.savefig("plot_tdust_vs_lir.png", dpi=150, bbox_inches="tight")