Note
Go to the end to download the full example code.
Dust IR-emission library comparison: models and templates
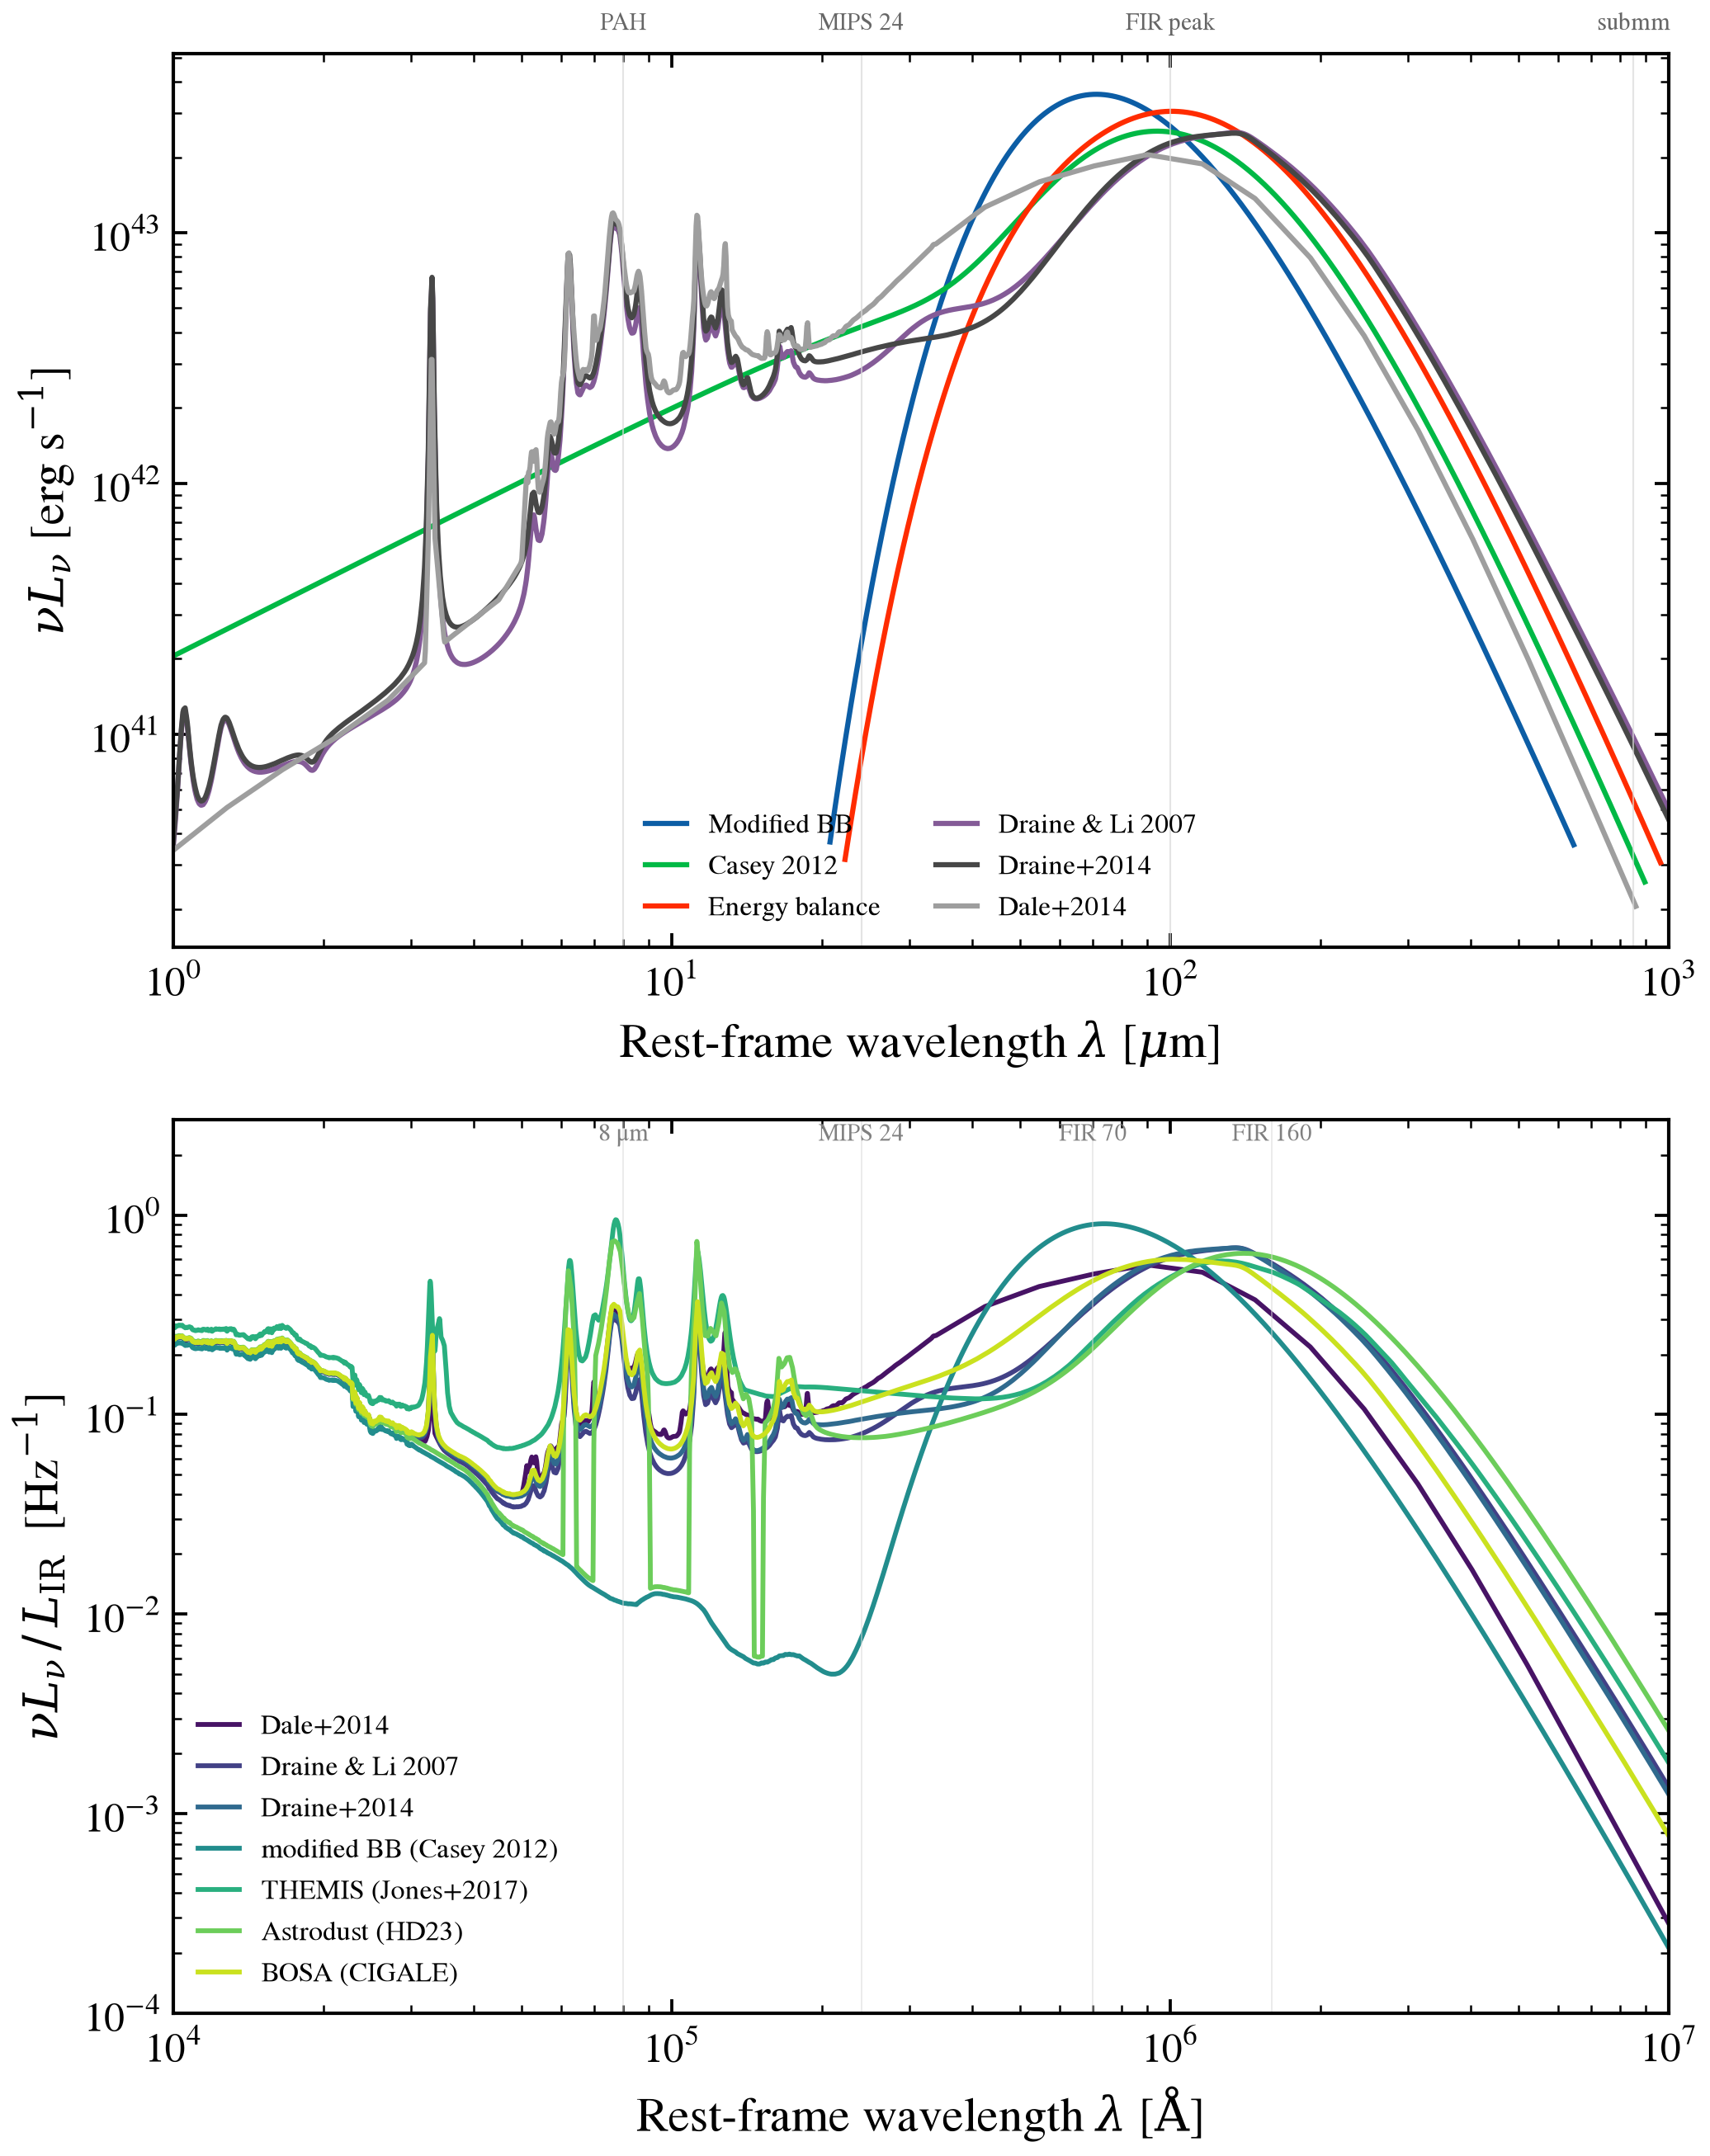
All dust IR-emission libraries shipped in tengri, shown on two scales:
(Top) Fixed L_abs = 1e10 L_sun comparison using simple function calls (analytic models and template-based libraries). The differences sit entirely in the SED shape — peak wavelength (T_dust proxy), PAH-feature amplitude in the 3–20 μm window, and how steeply the sub-mm tail falls.
Analytic: modified blackbody, Casey 2012, energy-balance split
Templates: Draine & Li 2007, Draine+2014, Dale+2014
(Bottom) Seven-library L_IR-normalized comparison via full SEDModel with constant SFH and dust parameters (τ_diff=1, τ_bc=1.5):
dale2014: Dale+2014 SFR-driven template familydl07: Draine & Li 2007 grain mixturedl14: Draine+2014 update (extended PAH/silicate)mbb: single-T modified blackbody (Casey 2012)themis: THEMIS amorphous-carbon grains (Jones+2017)astrodust: Hensley & Draine 2023 unified grain modelbosa: BOSA template set (Boquien et al. CIGALE)
The L_IR normalization isolates the shape differences; combined with the fixed-L_abs view, both perspectives reveal the diversity of grain models and their physical implications.
import os

os.environ["TF_CPP_MIN_LOG_LEVEL"] = "2"  # suppress XLA/PjRt C++ INFO+WARNING logs

import warnings

import jax
import jax.numpy as jnp
import matplotlib.pyplot as plt
import numpy as np

import tengri
from tengri.dust import (
    casey2012,
    dale2014,
    draine_li2007,
    draine_li2014,
    energy_balance_split,
    modified_blackbody,
)
from tengri.plot import setup_style

setup_style()
warnings.filterwarnings("ignore", message=".*BakedInBackend.*")
warnings.filterwarnings("ignore", message=".*experimental.*")

LIBS = [
    ("dale2014", "Dale+2014"),
    ("draine_li2007", "Draine & Li 2007"),
    ("draine_li2014", "Draine+2014"),
    ("modified_blackbody", "modified BB (Casey 2012)"),
    ("themis", "THEMIS (Jones+2017)"),
    ("astrodust", "Astrodust (HD23)"),
    ("bosa", "BOSA (CIGALE)"),
]
COLORS = plt.cm.viridis(np.linspace(0.05, 0.92, len(LIBS)))

C_AA_PER_S = 2.998e18
SFH = {"type": "const", "all_params": tengri.Fixed(tengri.DEFAULT), "log_total_mass": 11.0}

ssp = tengri.load_ssp()

# --- Top panel: fixed L_abs comparison (from plot_dust_emission_models.py) ---
fig = plt.figure(figsize=(7.2, 9.0))
ax_fixed = fig.add_subplot(211)

L_SUN = 3.828e33
L_ABS = 1e10 * L_SUN

wave_aa = jnp.logspace(np.log10(1e4), np.log10(1e7), 2000)
wave_um = np.asarray(wave_aa) * 1e-4


def _maybe(fn, *args, **kwargs):
    try:
        return fn(*args, **kwargs)
    except FileNotFoundError:
        return None


MODELS = [
    ("Modified BB", "C0", modified_blackbody(wave_aa, L_ABS, dust_T=35.0, dust_beta_ir=1.8)),
    (
        "Casey 2012",
        "C1",
        casey2012(wave_aa, L_ABS, dust_T=35.0, dust_beta_ir=1.8, dust_alpha_mir=2.0),
    ),
    (
        "Energy balance",
        "C3",
        energy_balance_split(wave_aa, L_ABS, dust_T_warm=35.0, dust_T_cold=20.0),
    ),
    (
        "Draine & Li 2007",
        "C4",
        _maybe(draine_li2007, wave_aa, L_ABS, dust_umin=1.0, dust_gamma_dl=0.01, dust_qpah=2.5),
    ),
    (
        "Draine+2014",
        "C5",
        _maybe(draine_li2014, wave_aa, L_ABS, dust_umin=1.0, dust_gamma_dl=0.01, dust_qpah=2.5),
    ),
    ("Dale+2014", "C6", _maybe(dale2014, wave_aa, L_ABS, dust_alpha_dale=2.0)),
]

nu = C_AA_PER_S / np.asarray(wave_aa)

for label, color, lnu in MODELS:
    if lnu is None:
        continue
    nu_l_nu = nu * np.asarray(lnu)
    peak = np.nanmax(nu_l_nu)
    mask = nu_l_nu > 1e-3 * peak
    ax_fixed.loglog(wave_um[mask], nu_l_nu[mask], color=color, lw=1.5, label=label)

ax_fixed.set(
    xlim=(1, 1000),
    xlabel=r"Rest-frame wavelength $\lambda$ [$\mu$m]",
    ylabel=r"$\nu L_\nu$ [erg s$^{-1}$]",
)
ax_fixed.legend(frameon=False, fontsize=8, ncol=2, loc="lower center")

for lam_um, name in [(8, "PAH"), (24, "MIPS 24"), (100, "FIR peak"), (850, "submm")]:
    ax_fixed.axvline(lam_um, color="0.85", lw=0.5, alpha=0.7)
    ax_fixed.text(
        lam_um,
        1.02,
        name,
        fontsize=7,
        color="0.4",
        ha="center",
        va="bottom",
        transform=ax_fixed.get_xaxis_transform(),
    )

# --- Bottom panel: L_IR-normalized SEDModel comparison ---
ax_lir = fig.add_subplot(212)

plotted = 0
first_failure: Exception | None = None

for (lib, label), color in zip(LIBS, COLORS):
    try:
        model = tengri.SEDModel.build(
            ssp,
            sfh=SFH,
            dust_attenuation={
                "law": "power_law",
                "type": "two_component",
                "all_params": tengri.Fixed(tengri.DEFAULT),
                "tau_diff": 1.0,
                "tau_bc": 1.5,
            },
            dust_emission={"type": lib, "all_params": tengri.Fixed(tengri.DEFAULT)},
            redshift=tengri.Fixed(0.05),
        )
    except Exception as e:
        if first_failure is None:
            first_failure = e
        continue
    p = dict(model.spec.sample(jax.random.PRNGKey(0)))
    out = model.predict(p)
    wave = np.asarray(model.wavelengths)
    nu_l_nu = C_AA_PER_S / wave * np.asarray(out.rest_sed())
    # Normalize on integrated L_IR(8-1000 μm).
    ir = (wave > 8e4) & (wave < 1e7)
    if ir.sum() < 5:
        continue
    nu_ir = C_AA_PER_S / wave[ir]
    order = np.argsort(nu_ir)
    l_ir = np.trapezoid(np.asarray(out.rest_sed())[ir][order], nu_ir[order])
    if l_ir > 0:
        nu_l_nu = nu_l_nu / l_ir
    ax_lir.loglog(wave, nu_l_nu, color=color, lw=1.4, label=label)
    plotted += 1

# Two exits skip a library here: the build raising, and the `ir.sum() < 5`
# wavelength-coverage test. One guard covers both — what matters downstream is
# that the panel has curves, not which exit emptied it.
if plotted == 0:
    raise RuntimeError(
        f"none of the {len(LIBS)} IR libraries produced a curve, so the "
        f"L_IR-normalized panel is empty. First build failure: "
        f"{type(first_failure).__name__}: {first_failure}"
    ) from first_failure

ax_lir.set(
    xlim=(1e4, 1e7),
    ylim=(1e-4, 3.0),
    xlabel=r"Rest-frame wavelength $\lambda$ [$\mathrm{\AA}$]",
    ylabel=r"$\nu L_\nu\,/\,L_{\rm IR}$  [Hz$^{-1}$]",
)

for um, name in [(8, "8 μm"), (24, "MIPS 24"), (70, "FIR 70"), (160, "FIR 160")]:
    lam = um * 1.0e4
    ax_lir.axvline(lam, color="0.85", lw=0.4, alpha=0.6)
    ax_lir.text(lam, 2.2, name, fontsize=7, color="0.5", ha="center", va="bottom")

ax_lir.legend(frameon=False, fontsize=8, loc="lower left")

fig.tight_layout()
plt.savefig("plot_ir_library_compare.png", dpi=150, bbox_inches="tight")
Total running time of the script: (0 minutes 5.507 seconds)