Note
Go to the end to download the full example code.
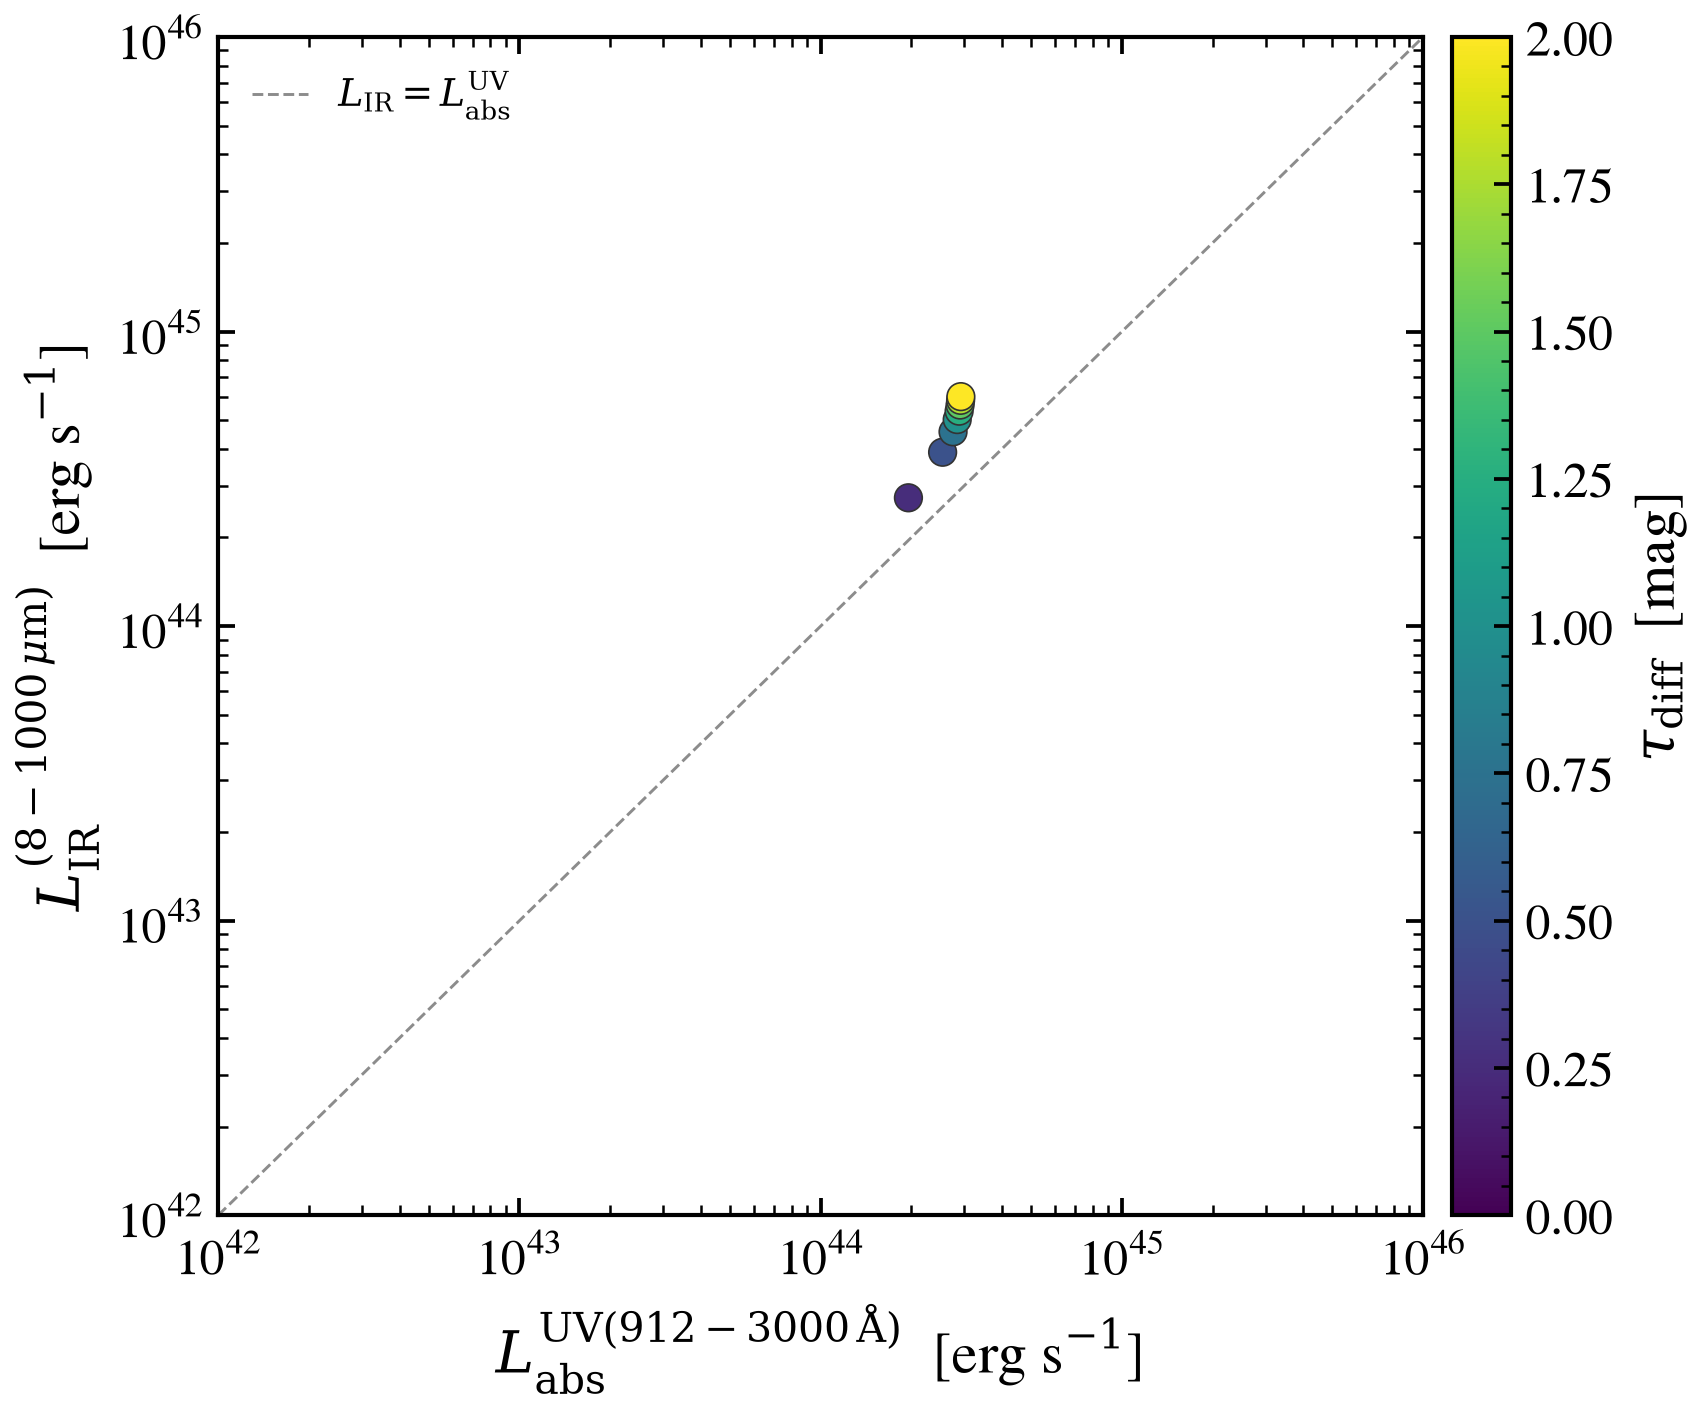
UV-IR energy balance: absorbed = re-emitted
The Charlot & Fall 2000 two-component dust model conserves energy:
every UV photon attenuated by the dust must come back out as IR
re-emission. We sweep τ_diff from 0 to 2 mag and on each step
plot two quantities — the absorbed UV power L_abs(λ<3000 Å)
inferred from the difference of (no-dust) minus (with-dust) attenuated
SEDs, and the integrated IR luminosity L_IR(8–1000 μm) from
the IR re-emission template (Dale+2014 here).
The two should be equal up to a small offset from the energy in the optical/NIR window that the model treats separately. Deviations from the diagonal indicate either model approximations or numerical integration error.
import os

os.environ["TF_CPP_MIN_LOG_LEVEL"] = "2"  # suppress XLA/PjRt C++ INFO+WARNING logs

import warnings

import jax
import matplotlib.pyplot as plt
import numpy as np

import tengri
from tengri.plot import setup_style

setup_style()
warnings.filterwarnings("ignore", message=".*BakedInBackend.*")

C_AA_PER_S = 2.998e18

ssp = tengri.load_ssp()


def _build(tau_diff):
    return tengri.SEDModel.build(
        ssp,
        sfh={
            "type": "const",
            "all_params": tengri.Fixed(tengri.DEFAULT),
            "log_total_mass": 11.11,
            "start_gyr": 13.0,
            "end_gyr": 0.0,
        },
        dust_attenuation={
            "law": "power_law",
            "type": "two_component",
            "all_params": tengri.Fixed(tengri.DEFAULT),
            "tau_diff": tau_diff,
            "tau_bc": 1.5 * tau_diff,
        },
        dust_emission={"type": "dale2014", "all_params": tengri.Fixed(tengri.DEFAULT)},
        redshift=tengri.Fixed(0.05),
    )


ref_model = _build(0.0)
p_ref = dict(ref_model.spec.sample(jax.random.PRNGKey(0)))
out_ref = ref_model.predict(p_ref)
wave = np.asarray(ref_model.wavelengths)
nu = C_AA_PER_S / wave
sed_ref = np.asarray(out_ref.rest_sed())
uv_band = (wave > 912) & (wave < 3000)
ir_band = (wave > 8e4) & (wave < 1e7)


def _power_in_band(sed, band):
    nu_b = nu[band]
    order = np.argsort(nu_b)
    return float(np.trapezoid(sed[band][order], nu_b[order]))


L_uv_ref = _power_in_band(sed_ref, uv_band)

tau_grid = np.linspace(0.0, 2.0, 9)
L_abs, L_ir = np.empty_like(tau_grid), np.empty_like(tau_grid)

for i, tau in enumerate(tau_grid):
    model = _build(float(tau))
    p = dict(model.spec.sample(jax.random.PRNGKey(0)))
    out = model.predict(p)
    sed = np.asarray(out.rest_sed())
    L_abs[i] = L_uv_ref - _power_in_band(sed, uv_band)
    L_ir[i] = _power_in_band(sed, ir_band)

fig, ax = plt.subplots(figsize=(6.0, 5.0))
diag = np.array([1e42, 1e46])
ax.plot(diag, diag, color="0.55", lw=0.7, ls="--", label=r"$L_{\rm IR} = L_{\rm abs}^{\rm UV}$")
sc = ax.scatter(L_abs, L_ir, c=tau_grid, cmap="viridis", s=44, lw=0.4, edgecolor="0.2", zorder=4)
ax.set(
    xscale="log",
    yscale="log",
    xlim=(1e42, 1e46),
    ylim=(1e42, 1e46),
    xlabel=r"$L_{\rm abs}^{\rm UV(912-3000\,\AA)}$  [erg s$^{-1}$]",
    ylabel=r"$L_{\rm IR}^{(8-1000\,\mu\mathrm{m})}$  [erg s$^{-1}$]",
)
ax.legend(frameon=False, fontsize=9, loc="upper left")
cbar = fig.colorbar(sc, ax=ax, pad=0.02)
cbar.set_label(r"$\tau_{\rm diff}$  [mag]")

fig.tight_layout()
plt.savefig("plot_uv_ir_energy_balance.png", dpi=150, bbox_inches="tight")
Total running time of the script: (0 minutes 4.944 seconds)