Note
Go to the end to download the full example code.
Birth-cloud vs diffuse-ISM dust: age dependence and parameter degeneracies
The Charlot & Fall 2000 two-component dust model splits attenuation into a
birth-cloud component (τ_bc) that only the youngest stellar ages see, and
a diffuse-ISM component (τ_diff) that attenuates all stellar light. The two
are degenerate for an old population but separate cleanly for a young one.
Panels:
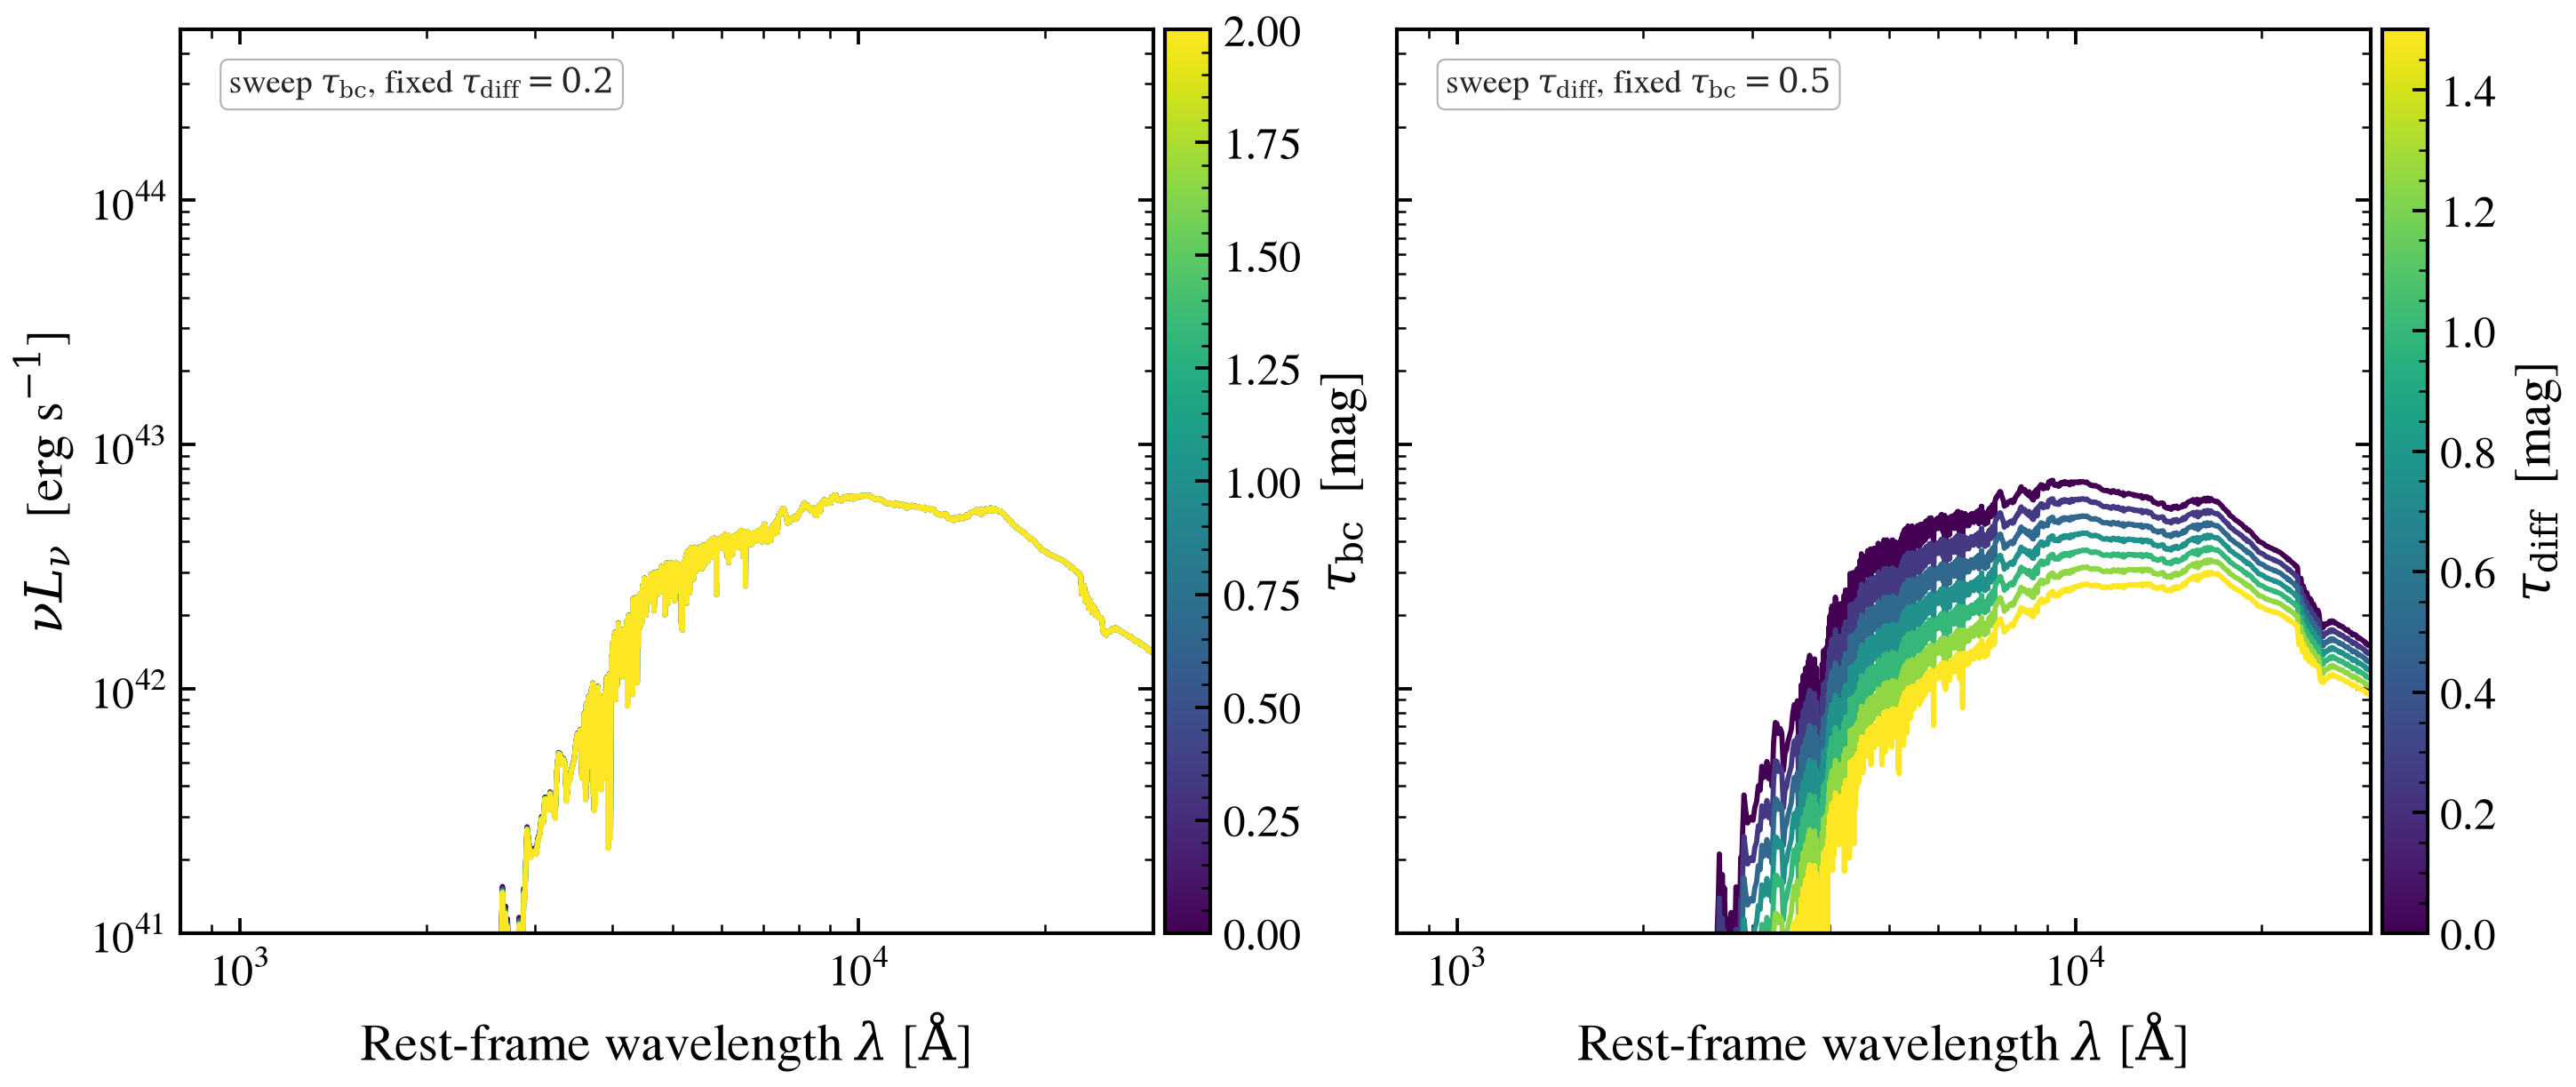
Top-left: τ_bc sweep at fixed τ_diff = 0.2 (young burst; far-UV suppressed)
Top-right: τ_diff sweep at fixed τ_bc = 0.5 (young burst; full SED suppressed)
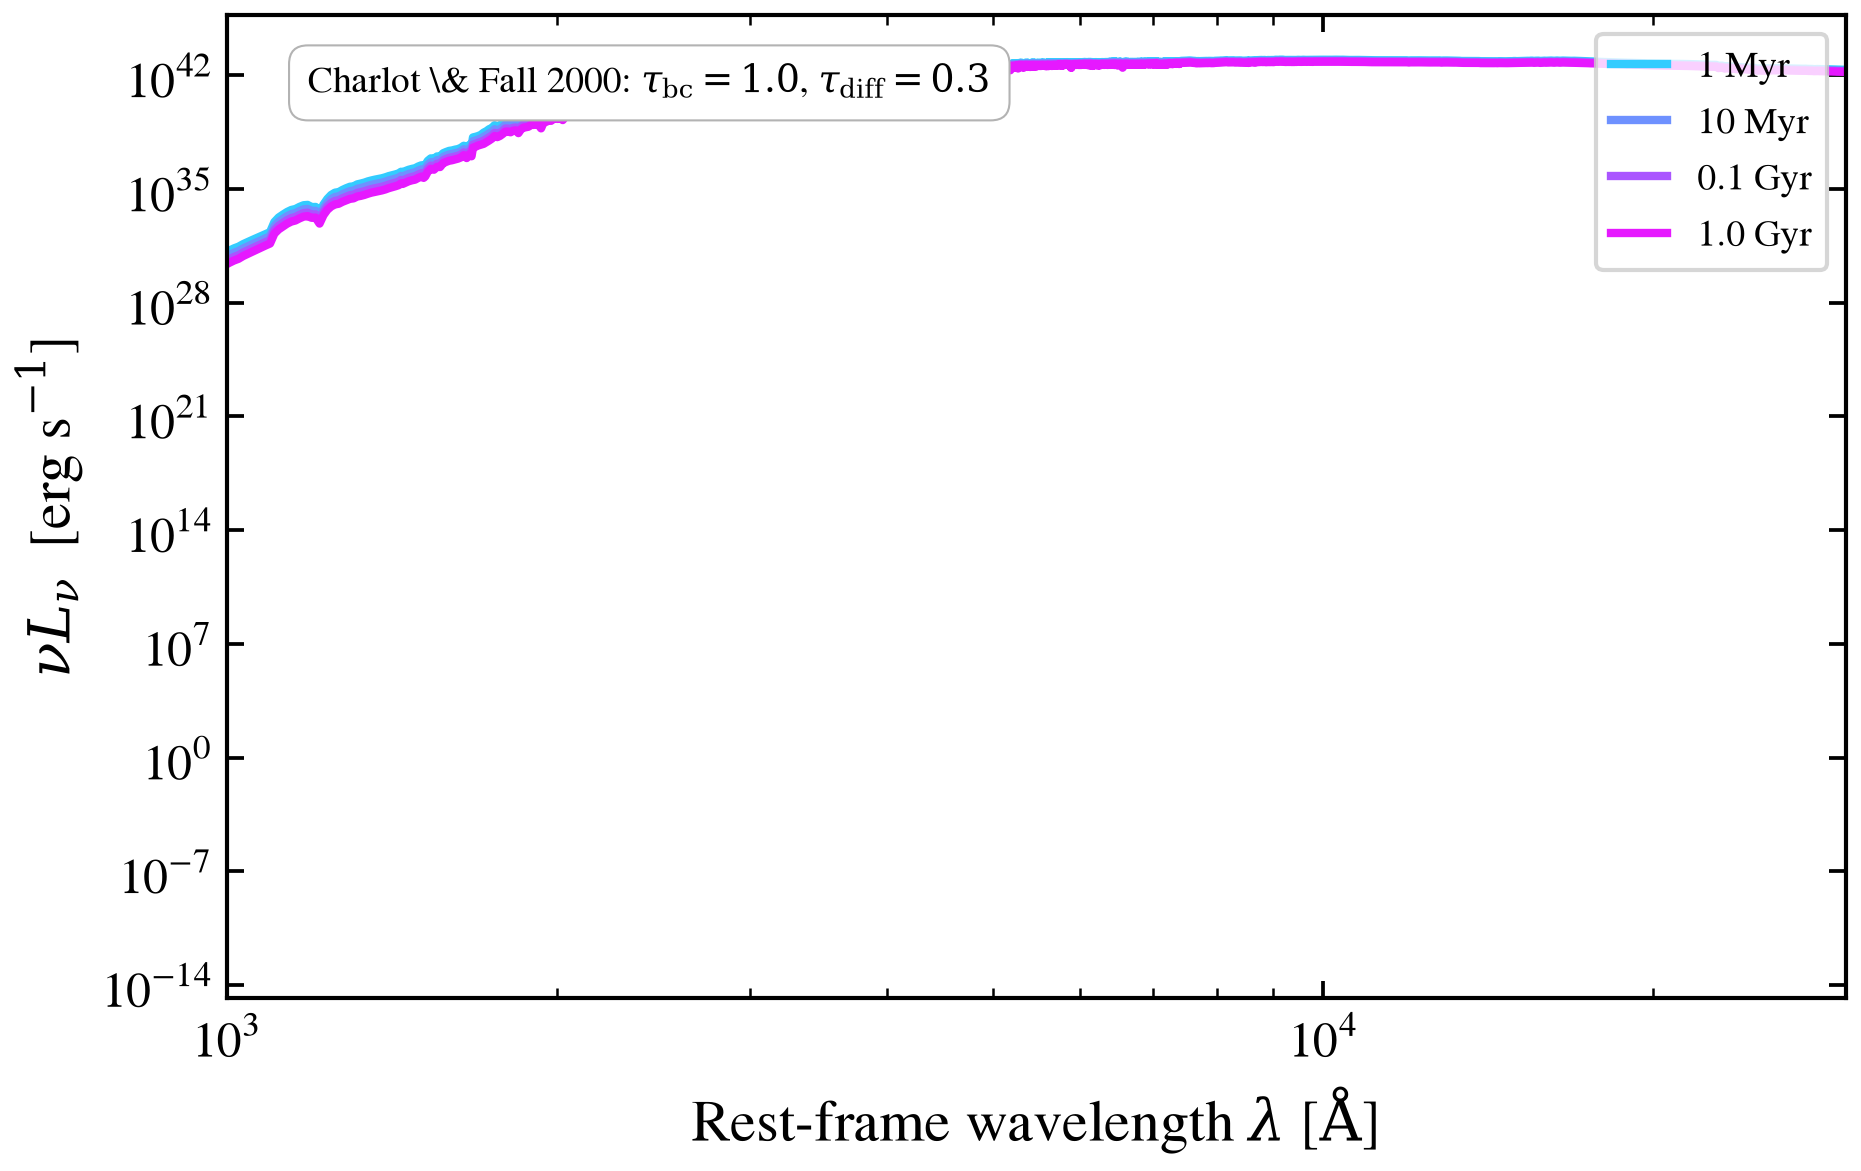
Bottom: age-dependent attenuation showing how single-age stellar populations (1 Myr to 1 Gyr) respond to the same dust parameters — young stars feel both components; older stars are unaffected by τ_bc.
Reference: Charlot & Fall 2000, ApJ, 539, 718.
/tengri/src/tengri/forward/sed_model.py:1716: SFHBurstAliasingWarning: SFH burst width sfh_tsnorm_width_gyr=0.1 Gyr is narrower than the SSP grid spacing 0.77 Gyr at peak sfh_tsnorm_peak_lbt_gyr=6 Gyr. Predictions will show a non-physical staircase as the burst peak crosses SSP grid boundaries (#299). Widen the burst to at least width_gyr ≳ 0.77 for smooth behavior.
  param_map_deltas.append(self._init_sfh(spec))
/tengri/src/tengri/forward/sed_model.py:1716: SFHBurstAliasingWarning: SFH burst width sfh_tsnorm_width_gyr=0.1 Gyr is narrower than the SSP grid spacing 0.864 Gyr at peak sfh_tsnorm_peak_lbt_gyr=7 Gyr. Predictions will show a non-physical staircase as the burst peak crosses SSP grid boundaries (#299). Widen the burst to at least width_gyr ≳ 0.864 for smooth behavior.
  param_map_deltas.append(self._init_sfh(spec))
/tengri/src/tengri/forward/sed_model.py:1716: SFHBurstAliasingWarning: SFH burst width sfh_tsnorm_width_gyr=0.1 Gyr is narrower than the SSP grid spacing 1.09 Gyr at peak sfh_tsnorm_peak_lbt_gyr=8 Gyr. Predictions will show a non-physical staircase as the burst peak crosses SSP grid boundaries (#299). Widen the burst to at least width_gyr ≳ 1.09 for smooth behavior.
  param_map_deltas.append(self._init_sfh(spec))
/tengri/src/tengri/forward/sed_model.py:1716: SFHBurstAliasingWarning: SFH burst width sfh_tsnorm_width_gyr=0.1 Gyr is narrower than the SSP grid spacing 1.22 Gyr at peak sfh_tsnorm_peak_lbt_gyr=9 Gyr. Predictions will show a non-physical staircase as the burst peak crosses SSP grid boundaries (#299). Widen the burst to at least width_gyr ≳ 1.22 for smooth behavior.
  param_map_deltas.append(self._init_sfh(spec))
import os

os.environ["TF_CPP_MIN_LOG_LEVEL"] = "2"  # suppress XLA/PjRt C++ INFO+WARNING logs

import warnings

import jax
import matplotlib as mpl
import matplotlib.pyplot as plt
import numpy as np

import tengri
from tengri.plot import setup_style

setup_style()
warnings.filterwarnings("ignore", message=".*BakedInBackend.*")

C_AA_PER_S = 2.998e18

ssp = tengri.load_ssp()
SFH = {
    "type": "dpl",
    "all_params": tengri.Fixed(tengri.DEFAULT),
    "tau_gyr": 0.3,
    "log_total_mass": 10.0,
    "alpha": 4.0,
    "beta": 2.0,
}


def _model(tau_diff, tau_bc):
    return tengri.SEDModel.build(
        ssp,
        sfh=SFH,
        dust_attenuation={
            "law": "power_law",
            "type": "two_component",
            "all_params": tengri.Fixed(tengri.DEFAULT),
            "tau_diff": tau_diff,
            "tau_bc": tau_bc,
            "slope": -0.7,
        },
        redshift=tengri.Fixed(0.05),
    )


fig, (ax_bc, ax_diff) = plt.subplots(
    1, 2, figsize=(11.5, 4.4), sharey=True, gridspec_kw={"wspace": 0.05}
)

tau_bc_vals = np.linspace(0.0, 2.0, 7)
tau_diff_vals = np.linspace(0.0, 1.5, 7)
norm_bc = mpl.colors.Normalize(vmin=tau_bc_vals.min(), vmax=tau_bc_vals.max())
norm_diff = mpl.colors.Normalize(vmin=tau_diff_vals.min(), vmax=tau_diff_vals.max())

for tau in tau_bc_vals:
    model = _model(tau_diff=0.2, tau_bc=float(tau))
    p = dict(model.spec.sample(jax.random.PRNGKey(0)))
    out = model.predict(p)
    wave = np.asarray(model.wavelengths)
    ax_bc.loglog(
        wave,
        C_AA_PER_S / wave * np.asarray(out.rest_sed()),
        color=plt.cm.viridis(norm_bc(tau)),
        lw=1.4,
    )

for tau in tau_diff_vals:
    model = _model(tau_diff=float(tau), tau_bc=0.5)
    p = dict(model.spec.sample(jax.random.PRNGKey(0)))
    out = model.predict(p)
    wave = np.asarray(model.wavelengths)
    ax_diff.loglog(
        wave,
        C_AA_PER_S / wave * np.asarray(out.rest_sed()),
        color=plt.cm.viridis(norm_diff(tau)),
        lw=1.4,
    )

for ax in (ax_bc, ax_diff):
    ax.set(
        xlim=(800, 3e4),
        ylim=(1e41, 5e44),
        xlabel=r"Rest-frame wavelength $\lambda$ [$\mathrm{\AA}$]",
    )

ax_bc.set_ylabel(r"$\nu L_\nu$  [erg s$^{-1}$]")
ax_bc.text(
    0.05,
    0.93,
    r"sweep $\tau_{\rm bc}$, fixed $\tau_{\rm diff}=0.2$",
    transform=ax_bc.transAxes,
    fontsize=9,
    color="0.15",
    bbox=dict(boxstyle="round,pad=0.25", fc="white", ec="0.7", lw=0.5),
)
ax_diff.text(
    0.05,
    0.93,
    r"sweep $\tau_{\rm diff}$, fixed $\tau_{\rm bc}=0.5$",
    transform=ax_diff.transAxes,
    fontsize=9,
    color="0.15",
    bbox=dict(boxstyle="round,pad=0.25", fc="white", ec="0.7", lw=0.5),
)

cb_bc = fig.colorbar(plt.cm.ScalarMappable(norm=norm_bc, cmap="viridis"), ax=ax_bc, pad=0.01)
cb_bc.set_label(r"$\tau_{\rm bc}$  [mag]")
cb_diff = fig.colorbar(plt.cm.ScalarMappable(norm=norm_diff, cmap="viridis"), ax=ax_diff, pad=0.01)
cb_diff.set_label(r"$\tau_{\rm diff}$  [mag]")

# --- Add bottom panel: age-dependent attenuation ---
# (from plot_birth_cloud_vs_diffuse_age.py)
import matplotlib.pyplot as plt

TAU_BC = 1.0
TAU_DIFF = 0.3

ages_myr = np.array([1.0, 10.0, 100.0, 1000.0])
peak_lbt_values = np.array([6.0, 7.0, 8.0, 9.0])

colors_age = plt.cm.cool(np.linspace(0.2, 0.9, len(ages_myr)))

fig_age = plt.figure(figsize=(6.5, 4.2))
ax_age = fig_age.add_subplot(111)

for i, (age_myr, peak_lbt_gyr) in enumerate(zip(ages_myr, peak_lbt_values)):
    model = tengri.SEDModel.build(
        ssp,
        sfh={
            "type": "tsnorm",
            "all_params": tengri.Fixed(tengri.DEFAULT),
            "peak_lbt_gyr": float(peak_lbt_gyr),
            "width_gyr": 0.1,
            "log_total_mass": 10.0,
        },
        dust_attenuation={
            "law": "power_law",
            "type": "two_component",
            "all_params": tengri.Fixed(tengri.DEFAULT),
            "tau_bc": TAU_BC,
            "tau_diff": TAU_DIFF,
            "slope": -0.7,
        },
        redshift=tengri.Fixed(0.0),
    )

    p = dict(model.spec.sample(jax.random.PRNGKey(0)))
    out = model.predict(p)

    wave = np.asarray(model.wavelengths)
    nu_lnu = C_AA_PER_S / wave * np.asarray(out.rest_sed())

    label = f"{age_myr:.0f} Myr" if age_myr < 100 else f"{age_myr / 1e3:.1f} Gyr"
    ax_age.loglog(wave, nu_lnu, color=colors_age[i], lw=2.0, label=label)

ax_age.set_xlim(1000, 30000)
ax_age.set_xlabel(r"Rest-frame wavelength $\lambda$ [$\mathrm{\AA}$]")
ax_age.set_ylabel(r"$\nu L_\nu$  [erg s$^{-1}$]")

ax_age.legend(fontsize=9, frameon=True, loc="upper right")

textstr = (
    r"Charlot \& Fall 2000: "
    + f"$\\tau_{{\\rm bc}}={TAU_BC:.1f}$, "
    + f"$\\tau_{{\\rm diff}}={TAU_DIFF:.1f}$"
)
ax_age.text(
    0.05,
    0.95,
    textstr,
    transform=ax_age.transAxes,
    fontsize=9,
    verticalalignment="top",
    bbox=dict(boxstyle="round,pad=0.5", fc="white", ec="0.7", lw=0.5),
)

fig_age.tight_layout()
fig_age.savefig("plot_birth_cloud_vs_diffuse_age_panel.png", dpi=150, bbox_inches="tight")

plt.savefig("plot_birth_cloud_vs_diffuse.png", dpi=150, bbox_inches="tight")