Note
Go to the end to download the full example code.
Kubota & Done 2018 disc: Accretion state effects on continuum
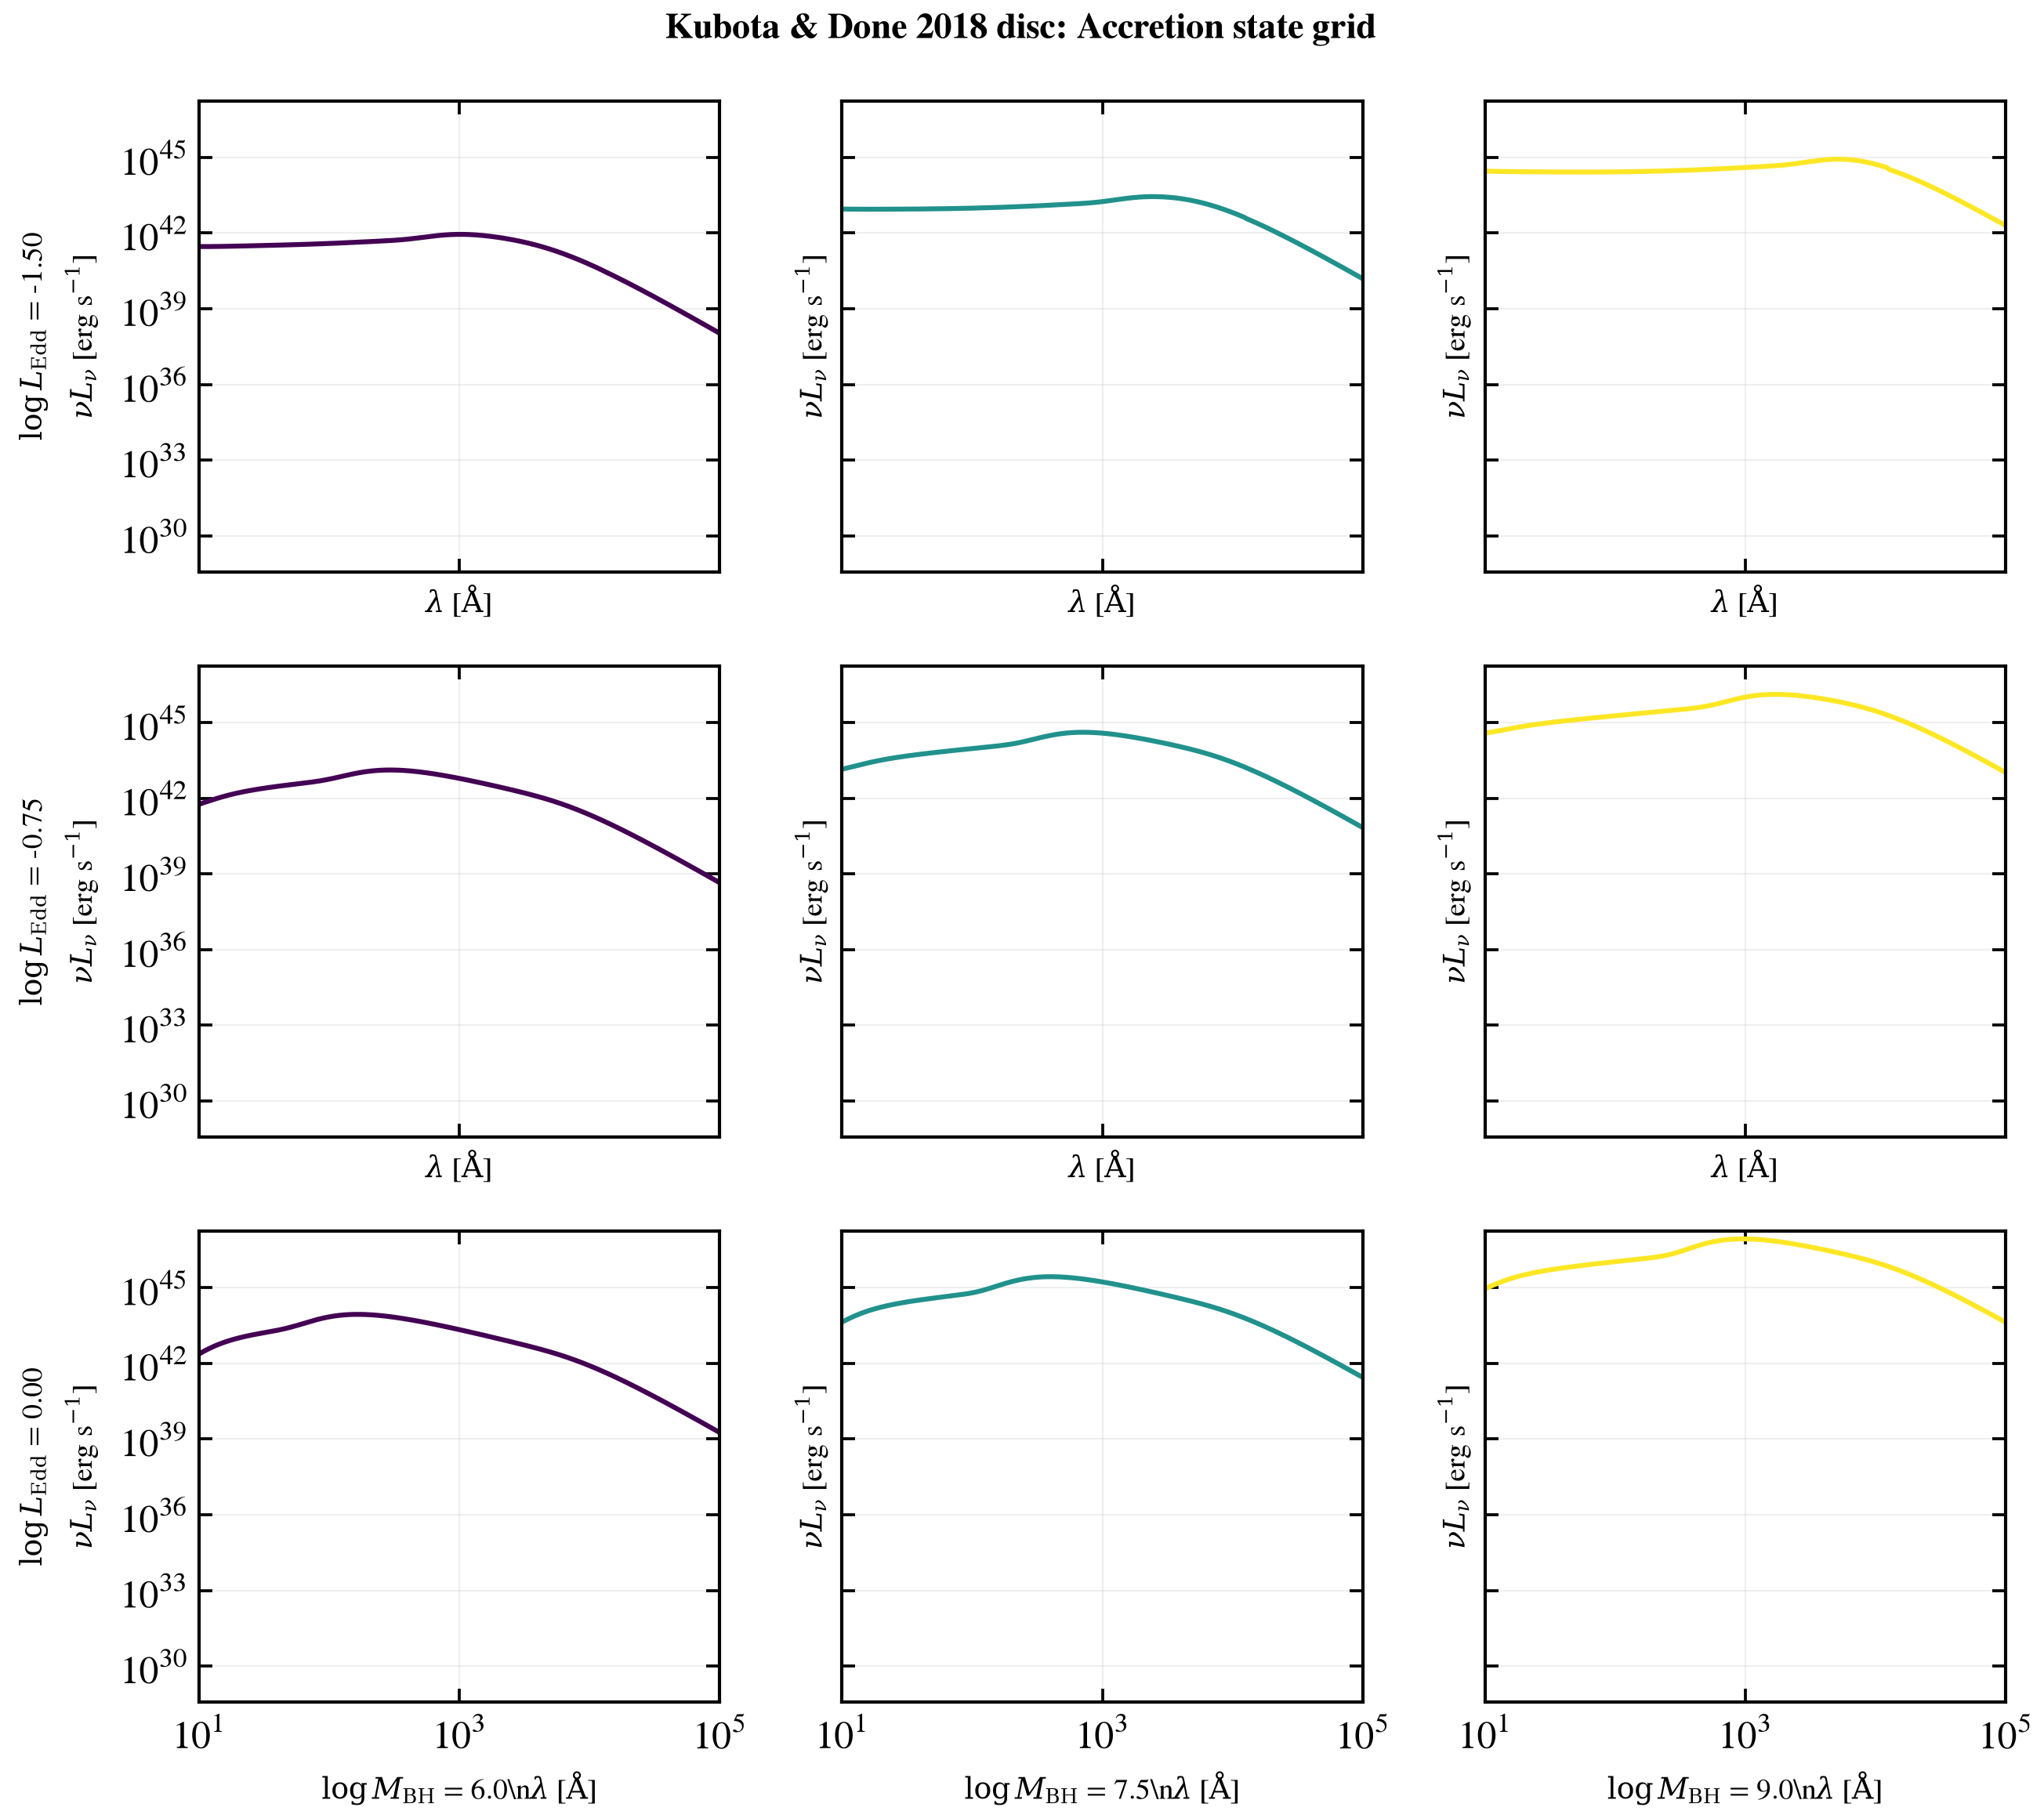
The Kubota & Done (2018) three-zone accretion disc model shows how the big blue bump (BBB) peaks at different wavelengths depending on black-hole mass and Eddington ratio. Sweeping across the accretion-state plane from low-luminosity advection-dominated (ADAF-like) to high-Eddington thin-disc reveals the transition: high mass + low Eddington gives cool outer discs peaking in the NIR; low mass + high Eddington gives hot inner zones peaking in the FUV/UV.
This example sweeps black-hole mass (log_mbh = 6→9) and Eddington ratio (log_ledd = -1.5→0) in a 3×3 grid, showing how the disc spectral shape transforms across the two-dimensional parameter space.
References
import os

os.environ["TF_CPP_MIN_LOG_LEVEL"] = "2"  # suppress XLA/PjRt C++ INFO+WARNING logs

import warnings

import jax
import matplotlib as mpl
import matplotlib.pyplot as plt
import numpy as np

import tengri
from tengri.plot import setup_style

setup_style()
warnings.filterwarnings("ignore", message=".*BakedInBackend.*")
warnings.filterwarnings("ignore", message=".*deprecated.*")

ssp = tengri.load_ssp()

# Fixed host galaxy: minimal stellar component suppressed
SFH = {"type": "const", "all_params": tengri.Fixed(tengri.DEFAULT), "log_total_mass": -10.0}
DUST = {
    "law": "power_law",
    "type": "two_component",
    "all_params": tengri.Fixed(tengri.DEFAULT),
    "tau_diff": 0.0,
    "tau_bc": 0.0,
}

# Grid: black-hole mass vs Eddington ratio
log_mbh_values = np.array([6.0, 7.5, 9.0])
log_ledd_values = np.array([-1.5, -0.75, 0.0])

# L_Edd = 3.2e4 * M_BH / M_sun * L_sun, so log_ledd = log(L_bol / L_Edd)
# => log_lbol = log_mbh + log(3.2e4) + log_ledd ≈ log_mbh + 4.505 + log_ledd
log_lbol_offset = np.log10(3.2e4)

fig, axes = plt.subplots(3, 3, figsize=(9.0, 8.0), sharex=True, sharey=True)

norm_mbh = mpl.colors.Normalize(vmin=log_mbh_values.min(), vmax=log_mbh_values.max())
cmap_mbh = plt.get_cmap("viridis")

# Collect all nu*L_nu values to determine axis range
all_nu_l_nu = []

for i_mbh, log_mbh in enumerate(log_mbh_values):
    for i_ledd, log_ledd in enumerate(log_ledd_values):
        ax = axes[i_ledd, i_mbh]

        # Compute log_lbol from Eddington relation
        log_lbol = log_mbh + log_lbol_offset + log_ledd

        model = tengri.SEDModel.build(
            ssp,
            sfh=SFH,
            dust_attenuation=DUST,
            agn={
                "disc": {
                    "type": "kubota_done",
                    "all_params": tengri.Fixed(tengri.DEFAULT),
                    "log_mbh": log_mbh,
                },
                "all_params": tengri.Fixed(tengri.DEFAULT),
                "log_lbol": log_lbol,
                "lum_ratio": 1.0,
            },
            redshift=tengri.Fixed(0.05),
        )
        p = dict(model.spec.sample(jax.random.PRNGKey(0)))
        out = model.predict(p)

        wave = np.asarray(model.wavelengths)
        c_aa_s = 2.998e18
        nu_l_nu = c_aa_s / wave * np.asarray(out.rest_sed())
        all_nu_l_nu.append(nu_l_nu)

        color = cmap_mbh(norm_mbh(log_mbh))
        ax.loglog(wave, nu_l_nu, color=color, lw=1.5)

        # Labels
        if i_mbh == 0:
            ax.set_ylabel(
                rf"$\log L_\mathrm{{Edd}}$ = {log_ledd:.2f}"
                + "\n"
                + r"$\nu L_\nu$ [erg s$^{-1}$]",
                fontsize=9,
            )
        else:
            ax.set_ylabel(r"$\nu L_\nu$ [erg s$^{-1}$]", fontsize=9)

        if i_ledd == 2:
            ax.set_xlabel(
                rf"$\log M_\mathrm{{BH}}$ = {log_mbh:.1f}\n" + r"$\lambda$ [$\mathrm{\AA}$]",
                fontsize=9,
            )
        else:
            ax.set_xlabel(r"$\lambda$ [$\mathrm{\AA}$]", fontsize=9)

        ax.set_xlim(10, 1e5)
        ax.grid(True, which="major", alpha=0.2)

# Set y-limits based on data range with small margin
ymax = max([np.max(arr) for arr in all_nu_l_nu])
ymin = min([np.min(arr) for arr in all_nu_l_nu])
ylim_max = ymax * 2.0  # ~0.3 dex headroom
ylim_min = ymin / 3.0  # ~0.5 dex margin below minimum
axes[0, 0].set_ylim(ylim_min, ylim_max)

fig.suptitle(
    "Kubota & Done 2018 disc: Accretion state grid",
    fontsize=11,
    weight="bold",
)
fig.tight_layout()
plt.savefig("plot_kd18_disc_sweep.png", dpi=150, bbox_inches="tight")
Total running time of the script: (0 minutes 26.242 seconds)