Note
Go to the end to download the full example code.
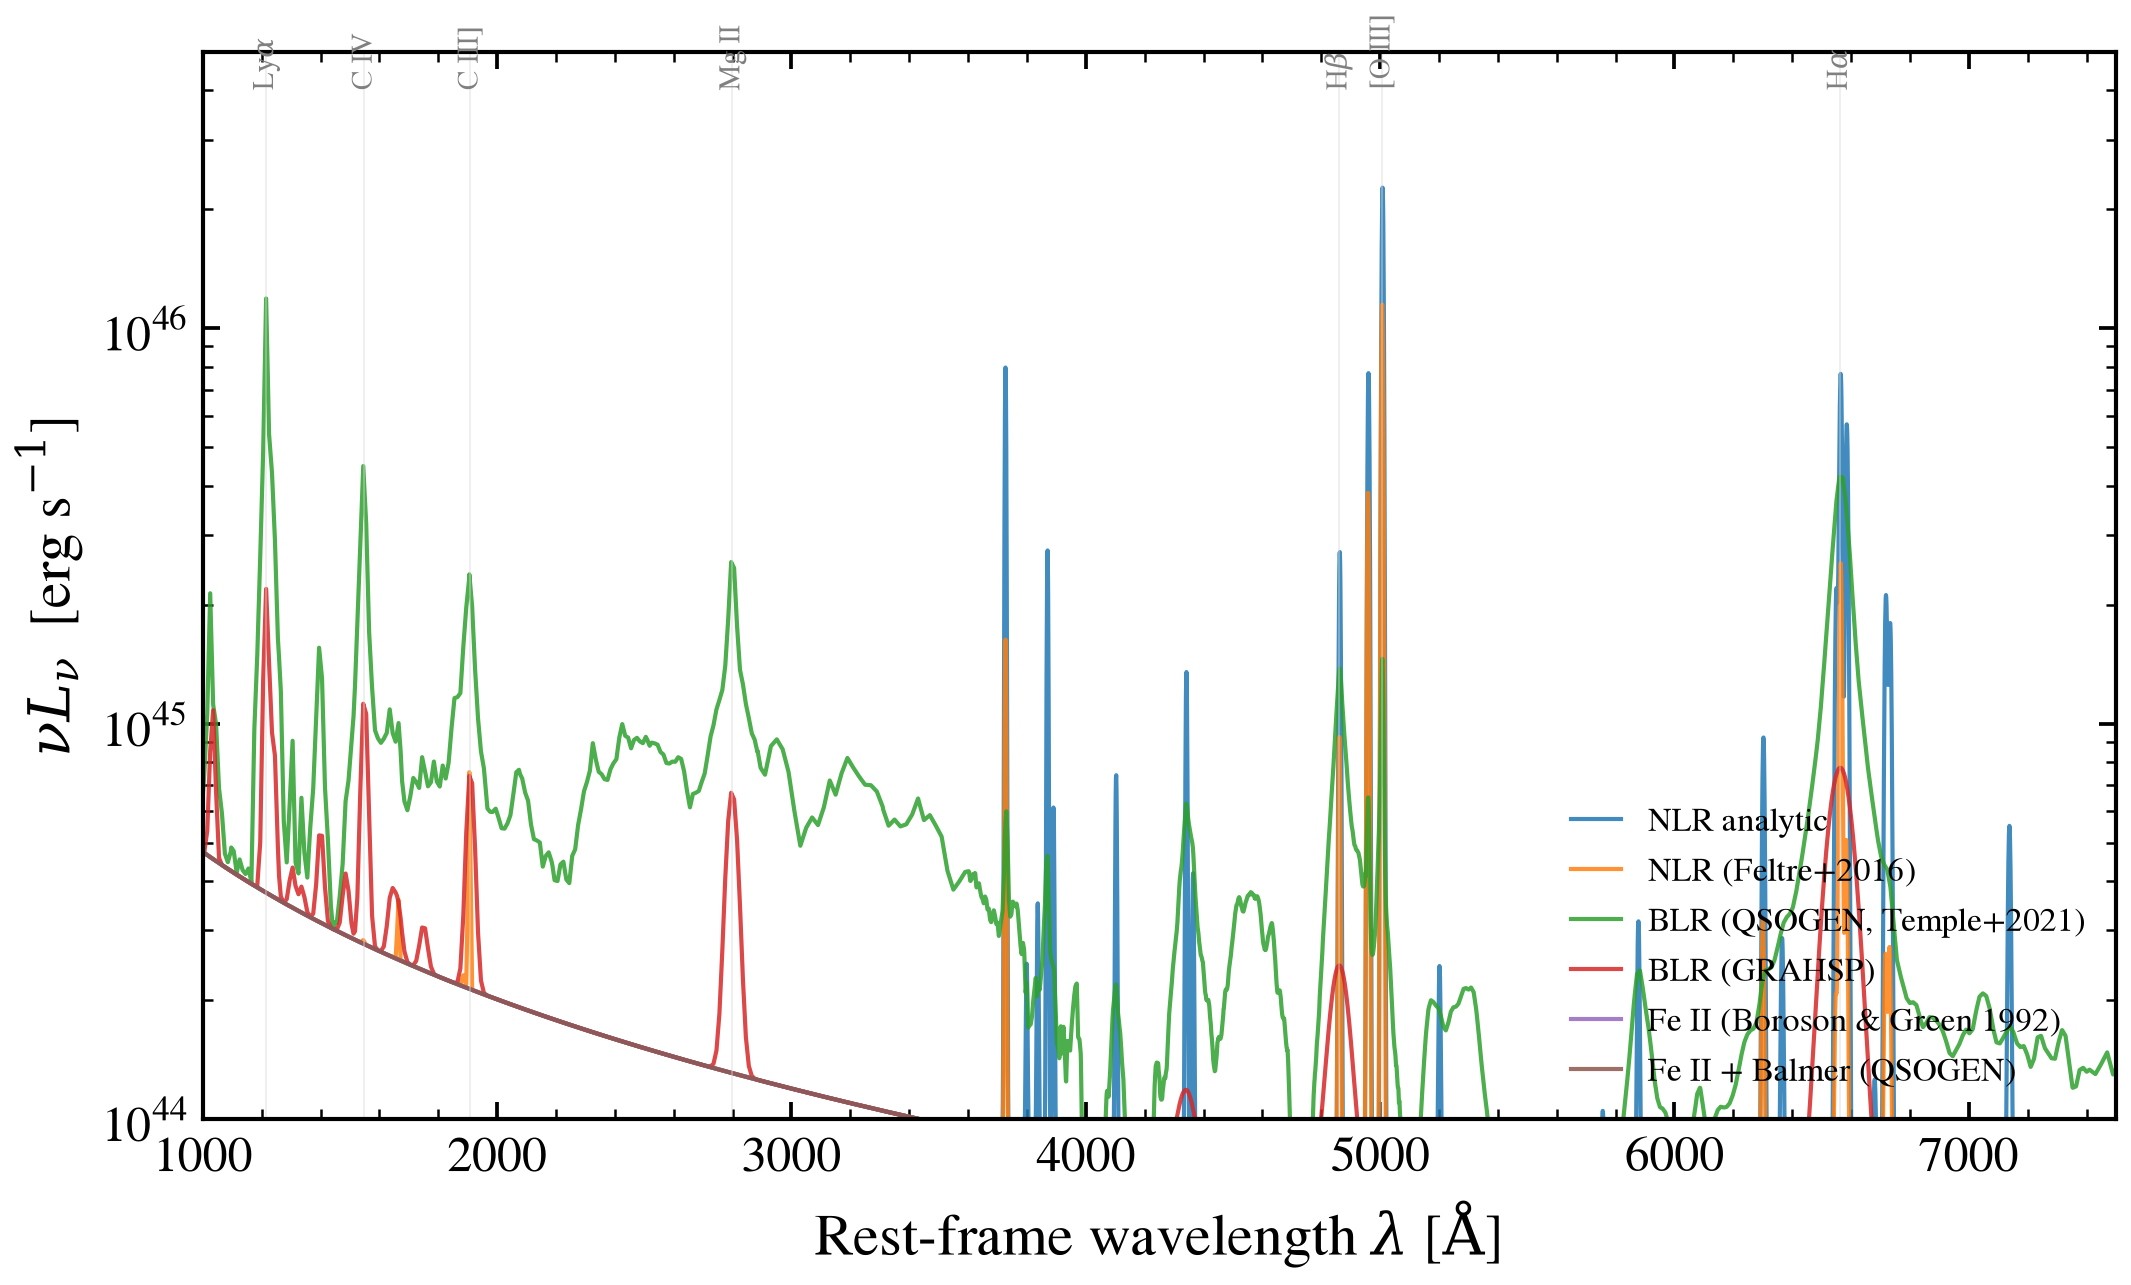
AGN emission-line backbones compared
The renderable line backbones registered under the three composable
line selectors — agn.nlr (narrow-line region), agn.blr
(broad-line region), and agn.feii (iron pseudo-continuum) — each
layered on the same disc + torus at fixed log L_bol = 12.5. The
backbone controls which optical/UV features the model produces:
narrow forbidden lines, broad permitted lines, or the blended Fe II
forest.
Backbones shown (one per registered implementation that renders from
the shipped data): NLR analytic/feltre, BLR grahsp/
qsogen, Fe II boroson_green/qsogen_balmer. The
synthesizer NLR/BLR grids need an external data bundle not shipped
with the gallery, and the cue NLR backbone is omitted here (its
line normalization is under review, see the tracked issue).
import os

os.environ["TF_CPP_MIN_LOG_LEVEL"] = "2"  # suppress XLA/PjRt C++ INFO+WARNING logs

import warnings

import jax
import matplotlib.pyplot as plt
import numpy as np

import tengri
from tengri.plot import setup_style

setup_style()
warnings.filterwarnings("ignore", message=".*BakedInBackend.*")

# (region selector, backbone type, label)
LINE_BACKBONES = [
    ("nlr", "analytic", "NLR analytic"),
    ("nlr", "feltre", "NLR (Feltre+2016)"),
    ("blr", "qsogen", "BLR (QSOGEN, Temple+2021)"),
    ("blr", "grahsp", "BLR (GRAHSP)"),
    ("feii", "boroson_green", "Fe II (Boroson & Green 1992)"),
    ("feii", "qsogen_balmer", "Fe II + Balmer (QSOGEN)"),
]
COLORS = plt.cm.tab10(np.linspace(0, 1, 10))[: len(LINE_BACKBONES)]

C_AA_PER_S = 2.998e18
SFH = {"type": "const", "all_params": tengri.Fixed(tengri.DEFAULT), "log_total_mass": -10.0}
DUST = {
    "law": "power_law",
    "type": "two_component",
    "all_params": tengri.Fixed(tengri.DEFAULT),
    "tau_diff": 0.0,
    "tau_bc": 0.0,
}

ssp = tengri.load_ssp()
fig, ax = plt.subplots(figsize=(7.4, 4.6))

for (region, kind, label), color in zip(LINE_BACKBONES, COLORS):
    model = tengri.SEDModel.build(
        ssp,
        sfh=SFH,
        dust_attenuation=DUST,
        agn={
            "disc": {"type": "multicolor", "all_params": tengri.Fixed(tengri.DEFAULT)},
            "torus": {"type": "skirtor", "all_params": tengri.Fixed(tengri.DEFAULT)},
            region: {"type": kind, "all_params": tengri.Fixed(tengri.DEFAULT)},
            "all_params": tengri.Fixed(tengri.DEFAULT),
            "log_lbol": 12.5,
            "lum_ratio": 1.0,
        },
        redshift=tengri.Fixed(0.05),
    )
    p = dict(model.spec.sample(jax.random.PRNGKey(0)))
    out = model.predict(p)
    wave = np.asarray(model.wavelengths)
    nu_l_nu = C_AA_PER_S / wave * np.asarray(out.rest_sed())
    ax.semilogy(wave, nu_l_nu, color=color, lw=1.0, label=label, alpha=0.85)

ax.set(
    xlim=(1000, 7500),
    ylim=(1e44, 5e46),
    xlabel=r"Rest-frame wavelength $\lambda$ [$\mathrm{\AA}$]",
    ylabel=r"$\nu L_\nu$  [erg s$^{-1}$]",
)

LINE_MARKS = [
    (1216, r"Ly$\alpha$"),
    (1549, "C IV"),
    (1909, "C III]"),
    (2798, "Mg II"),
    (4861, r"H$\beta$"),
    (5007, "[O III]"),
    (6563, r"H$\alpha$"),
]
for lam, name in LINE_MARKS:
    ax.axvline(lam, color="0.85", lw=0.4, alpha=0.5)
    ax.text(lam, 4e46, name, fontsize=7, color="0.5", ha="center", va="bottom", rotation=90)

ax.legend(frameon=False, fontsize=8, loc="lower right")

fig.tight_layout()
plt.savefig("plot_agn_lines_compare.png", dpi=150, bbox_inches="tight")
Total running time of the script: (0 minutes 11.242 seconds)