Note
Go to the end to download the full example code.
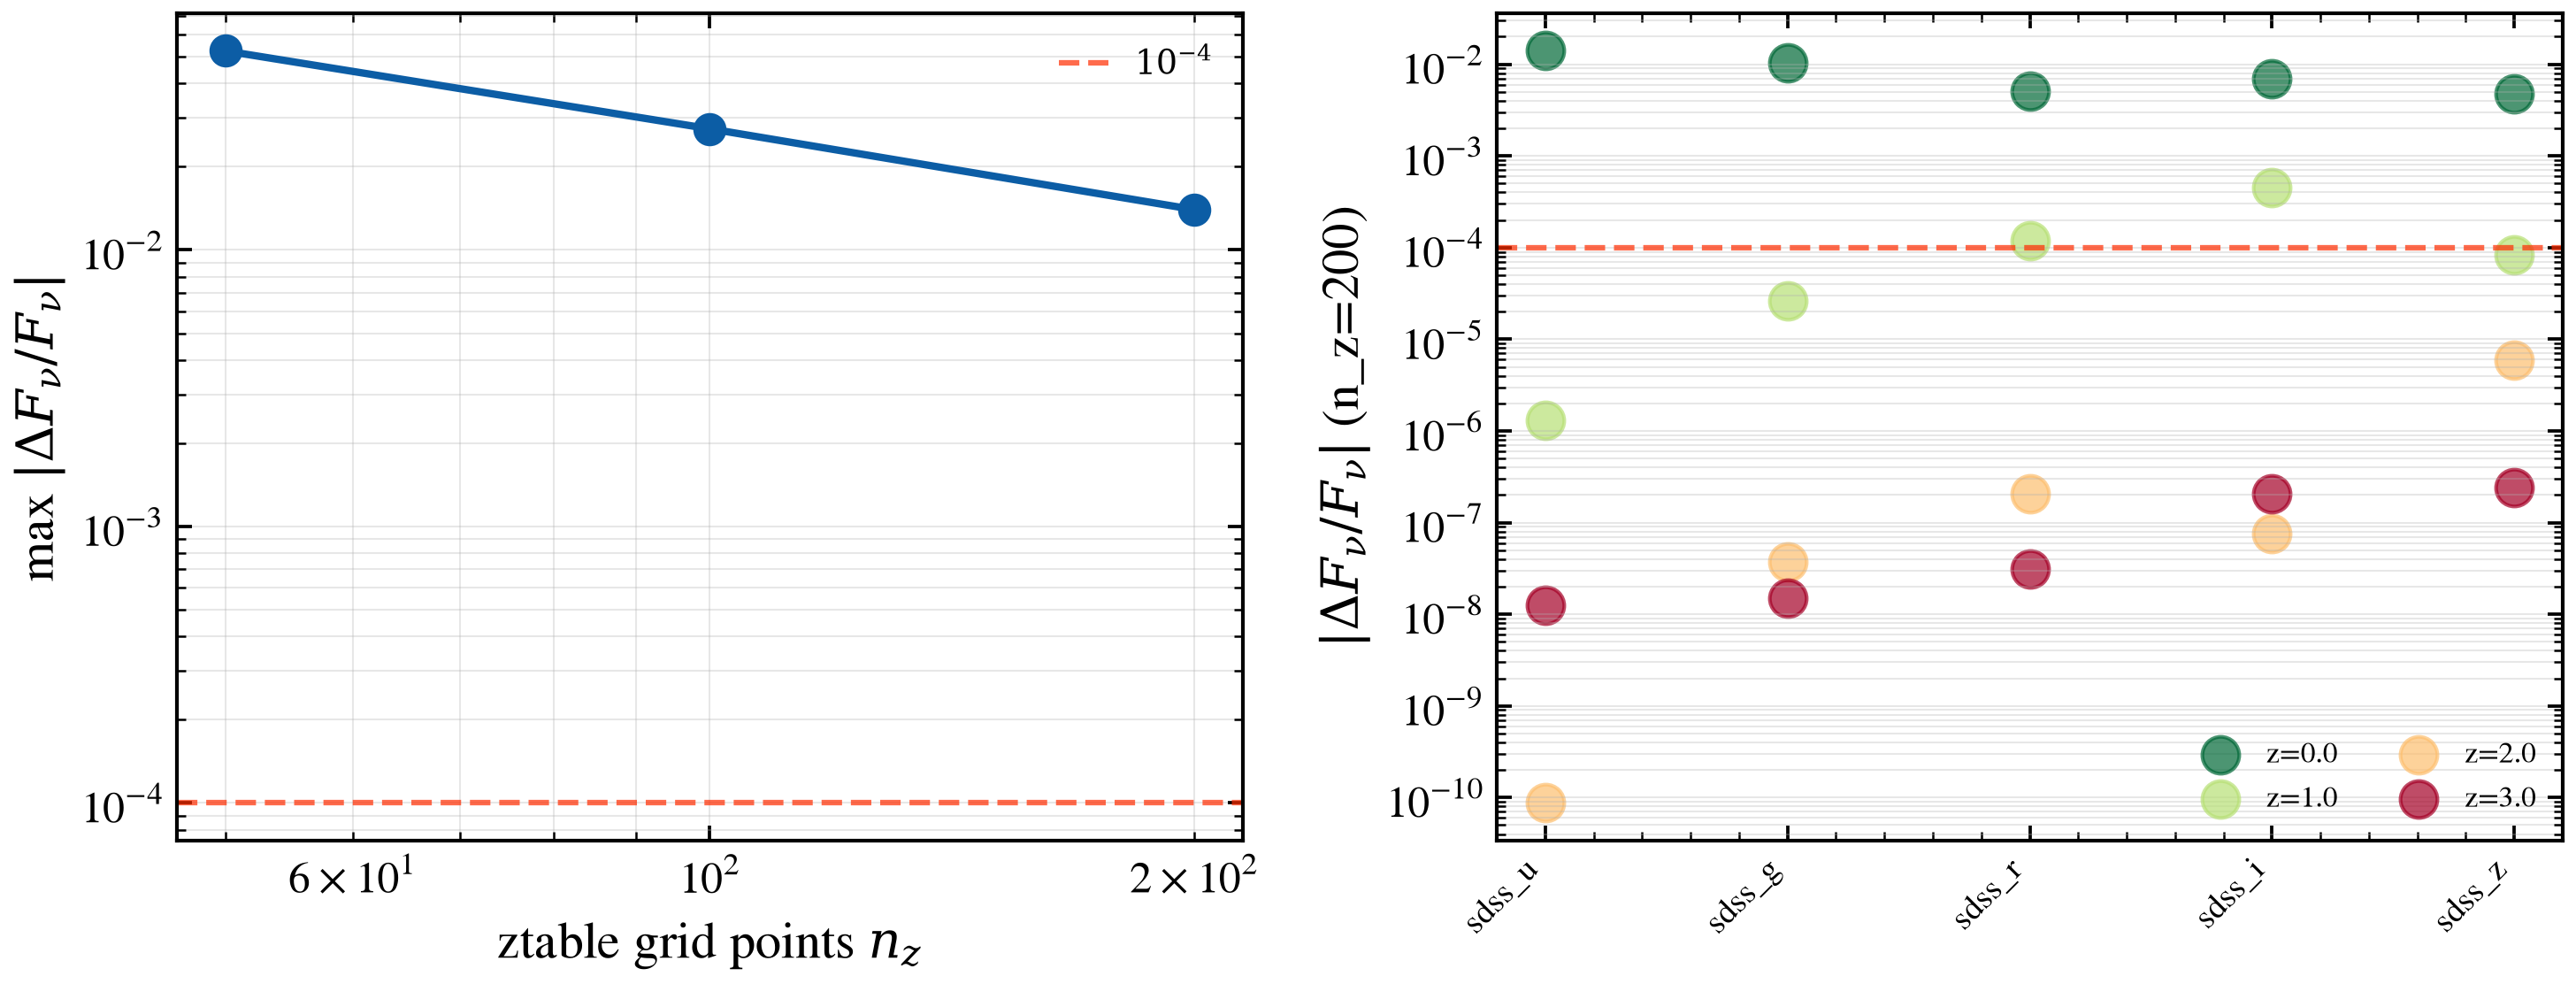
WavePrecomp photometric accuracy across redshift grids
The WavePrecomp approximation pre-integrates SSP × filter LUTs and
interpolates photometry through a redshift table, trading exact calculations
for speed. This diagnostic compares exact-wave-grid photometry against
WavePrecomp variants at different ztable densities n_z, showing how
fractional errors decrease with finer redshift grids.
Reference: ADR-0007 (precomputation architecture).
import warnings

import jax
import matplotlib.pyplot as plt
import numpy as np

import tengri
from tengri.plot import setup_style

setup_style()
warnings.filterwarnings("ignore", message=".*BakedInBackend.*")

ssp = tengri.load_ssp("fsps_prsc_miles_chabrier")
obs = tengri.Observation(
    photometry=tengri.Photometry.from_names(["sdss_u", "sdss_g", "sdss_r", "sdss_i", "sdss_z"])
)

baseline_spec = {
    "sfh": {"type": "tsnorm", "all_params": tengri.Fixed(tengri.DEFAULT)},
    "dust_attenuation": {
        "law": "power_law",
        "type": "two_component",
        "all_params": tengri.Fixed(tengri.DEFAULT),
        "tau_diff": 0.3,
        "tau_bc": 0.2,
    },
    "redshift": tengri.Uniform(0.0, 3.0),
}

model_exact = tengri.SEDModel.build(ssp, observation=obs, approx=None, **baseline_spec)

n_z_grid = [50, 100, 200]
models_precomp = {
    n_z: tengri.SEDModel.build(
        ssp,
        observation=obs,
        approx=tengri.WavePrecomp(n_z=n_z, z_min=0.0, z_max=3.0),
        **baseline_spec,
    )
    for n_z in n_z_grid
}

baseline_params = dict(model_exact.spec.sample(jax.random.PRNGKey(0)))
test_redshifts = np.array([0.0, 1.0, 2.0, 3.0])

reference_phot = {
    z: np.asarray(model_exact.predict_photometry({**baseline_params, "redshift": float(z)}))
    for z in test_redshifts
}

max_fractional_errors = {}
for n_z in n_z_grid:
    errors = []
    for z in test_redshifts:
        phot = np.asarray(
            models_precomp[n_z].predict_photometry({**baseline_params, "redshift": float(z)})
        )
        frac_err = np.abs(phot - reference_phot[z]) / np.maximum(np.abs(reference_phot[z]), 1e-30)
        errors.extend(frac_err)
    max_fractional_errors[n_z] = np.max(errors)

fig, (ax_left, ax_right) = plt.subplots(
    1, 2, figsize=(10, 4), gridspec_kw={"width_ratios": [1, 1]}
)

n_z_plot = np.array(sorted(max_fractional_errors.keys()))
max_err_plot = np.array([max_fractional_errors[n] for n in n_z_plot])

ax_left.loglog(n_z_plot, max_err_plot, "o-", color="C0", markersize=8, lw=2)
ax_left.axhline(1e-4, color="C3", linestyle="--", lw=1.5, alpha=0.7, label=r"$10^{-4}$")
ax_left.set_xlabel(r"ztable grid points $n_z$")
ax_left.set_ylabel(r"max $|\Delta F_\nu / F_\nu|$")
ax_left.grid(True, alpha=0.3, which="both")
ax_left.legend(frameon=False, fontsize=9)

model_best = models_precomp[200]
band_names = ["sdss_u", "sdss_g", "sdss_r", "sdss_i", "sdss_z"]
x_pos = np.arange(len(band_names))
colors = plt.cm.RdYlGn_r(np.linspace(0, 1, len(test_redshifts)))

for i, z in enumerate(test_redshifts):
    phot = np.asarray(model_best.predict_photometry({**baseline_params, "redshift": float(z)}))
    frac_err = np.abs(phot - reference_phot[z]) / np.maximum(np.abs(reference_phot[z]), 1e-30)
    ax_right.scatter(x_pos, frac_err, s=100, alpha=0.7, color=colors[i], label=f"z={z:.1f}")

ax_right.set_yscale("log")
ax_right.set_xticks(x_pos)
ax_right.set_xticklabels(band_names, rotation=45, ha="right", fontsize=9)
ax_right.set_ylabel(r"$|\Delta F_\nu / F_\nu|$ (n_z=200)")
ax_right.legend(frameon=False, fontsize=8, loc="best", ncol=2)
ax_right.grid(True, alpha=0.3, which="both", axis="y")
ax_right.axhline(1e-4, color="C3", linestyle="--", lw=1.5, alpha=0.7)

fig.tight_layout()
plt.savefig("plot_diag_waveprecomp_accuracy.png", dpi=150, bbox_inches="tight")
Total running time of the script: (0 minutes 33.566 seconds)